Sites and Environmental Parameters
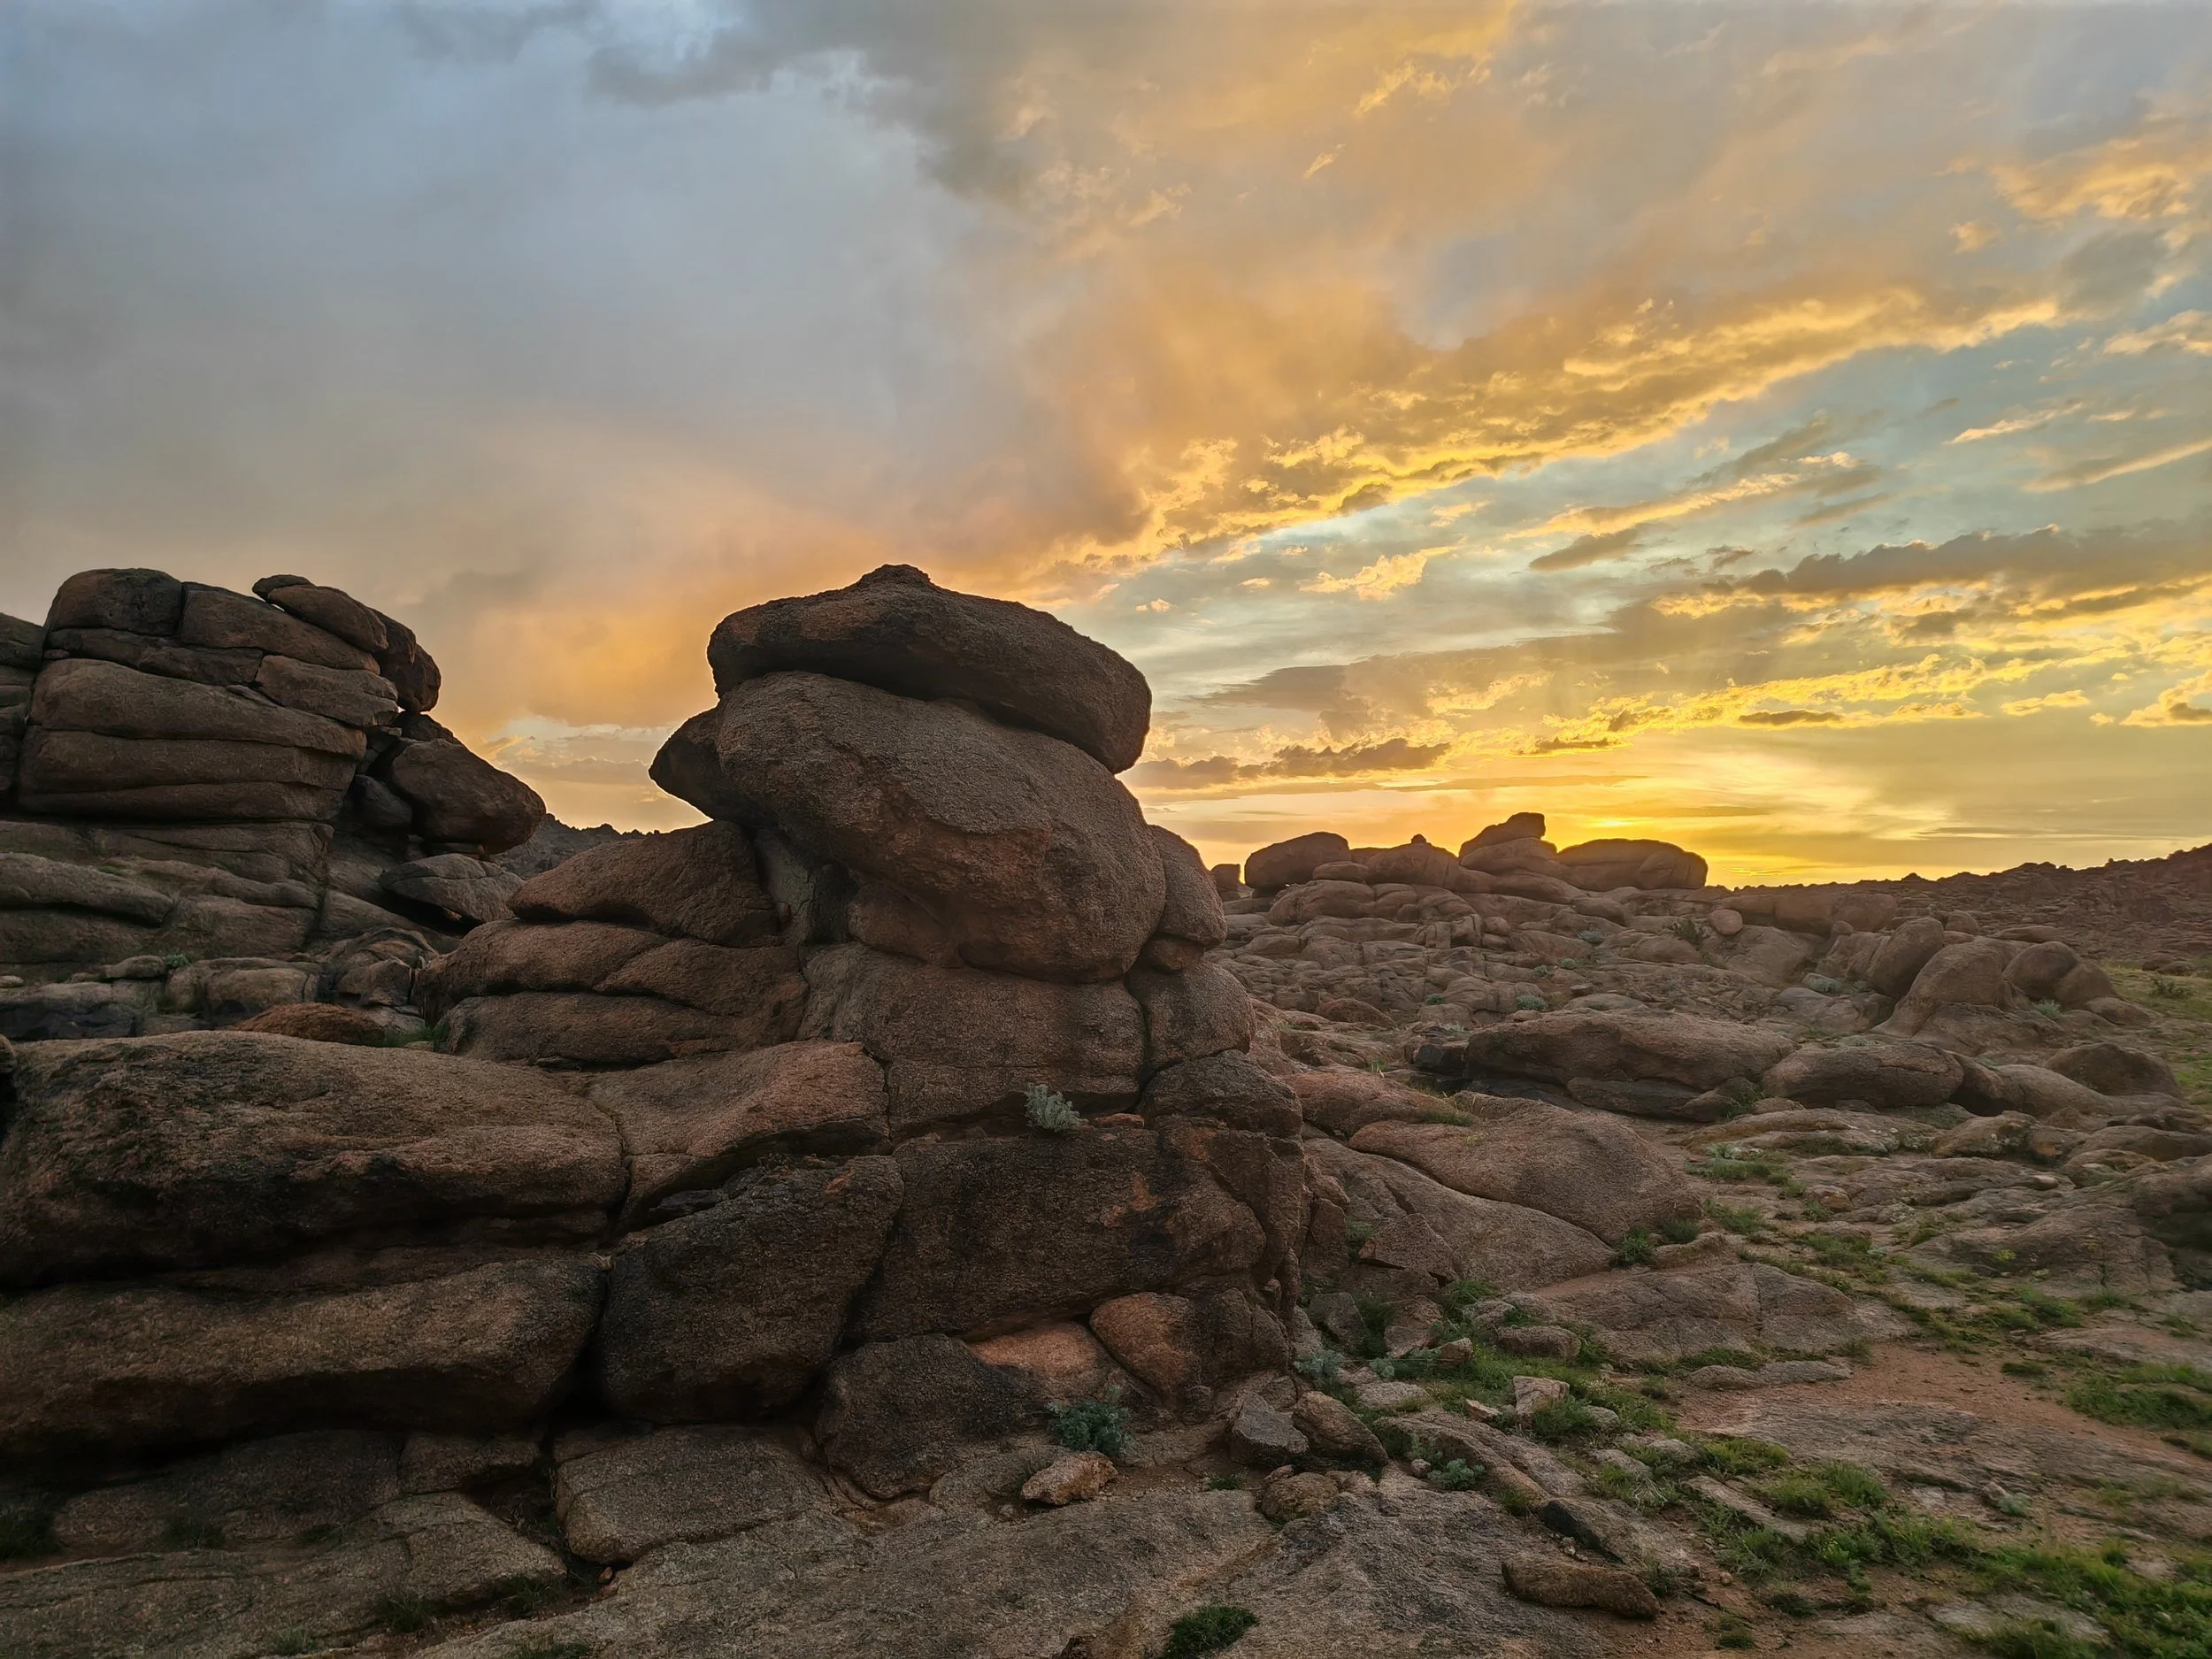
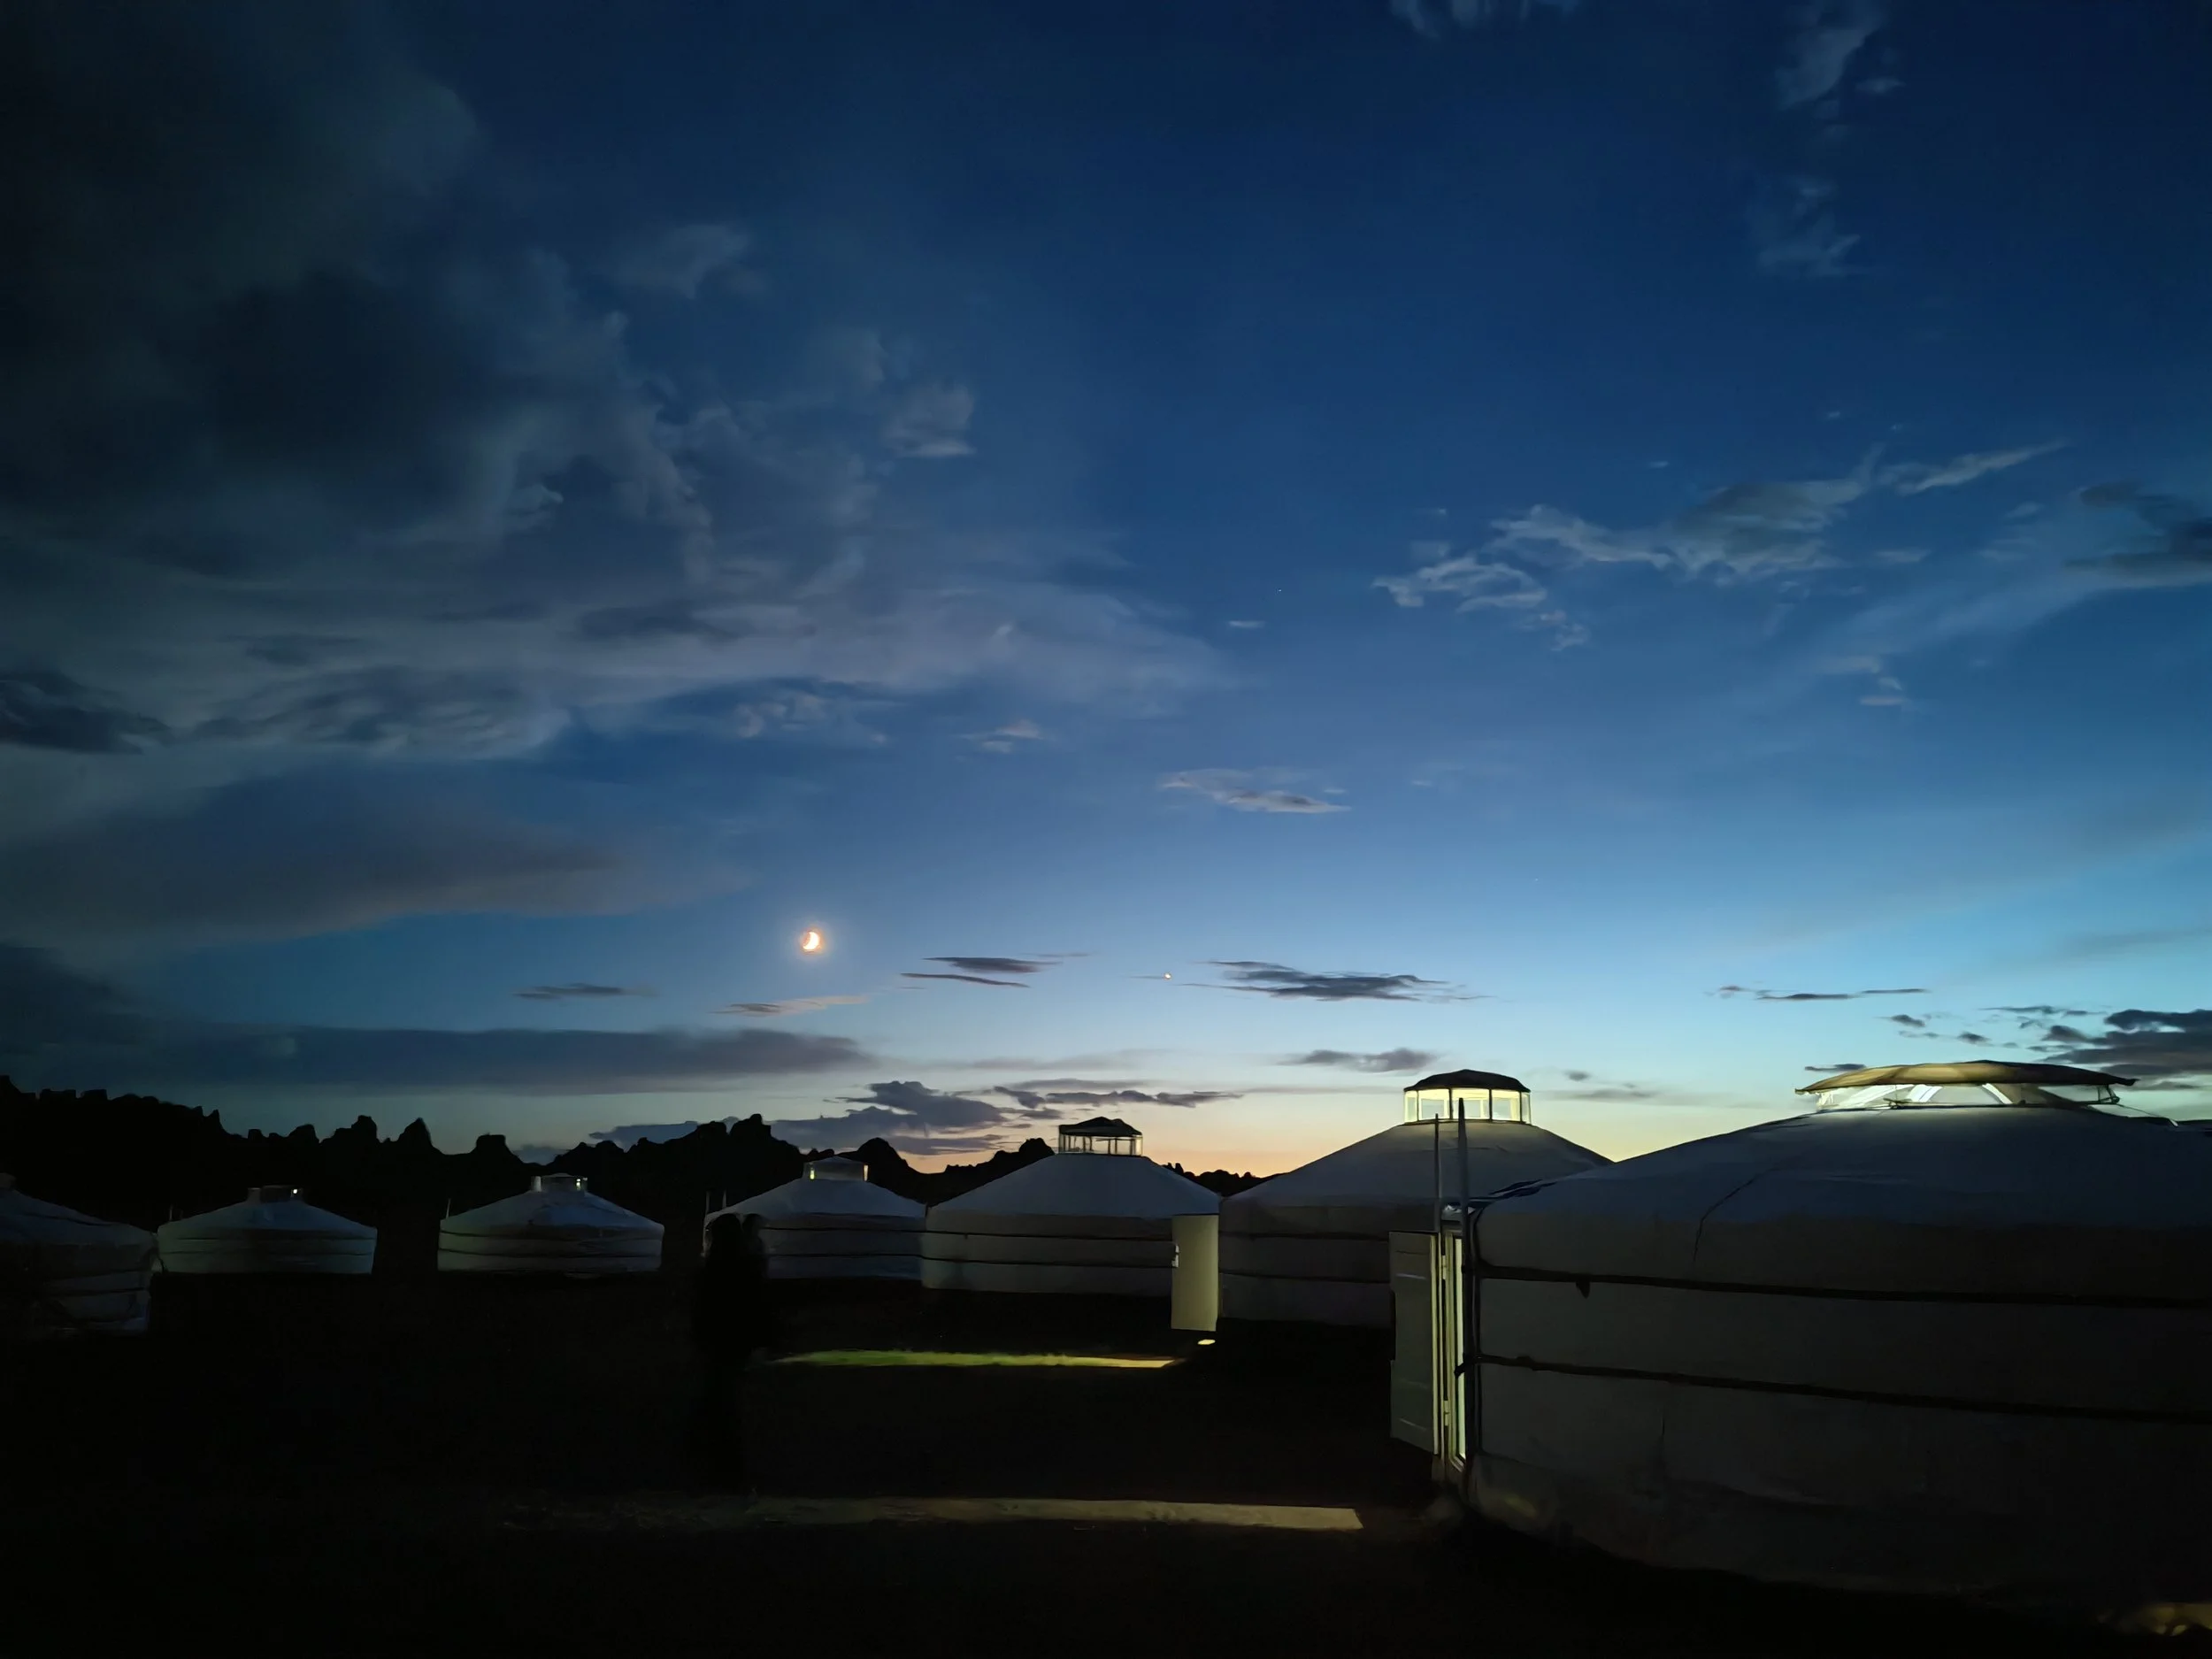
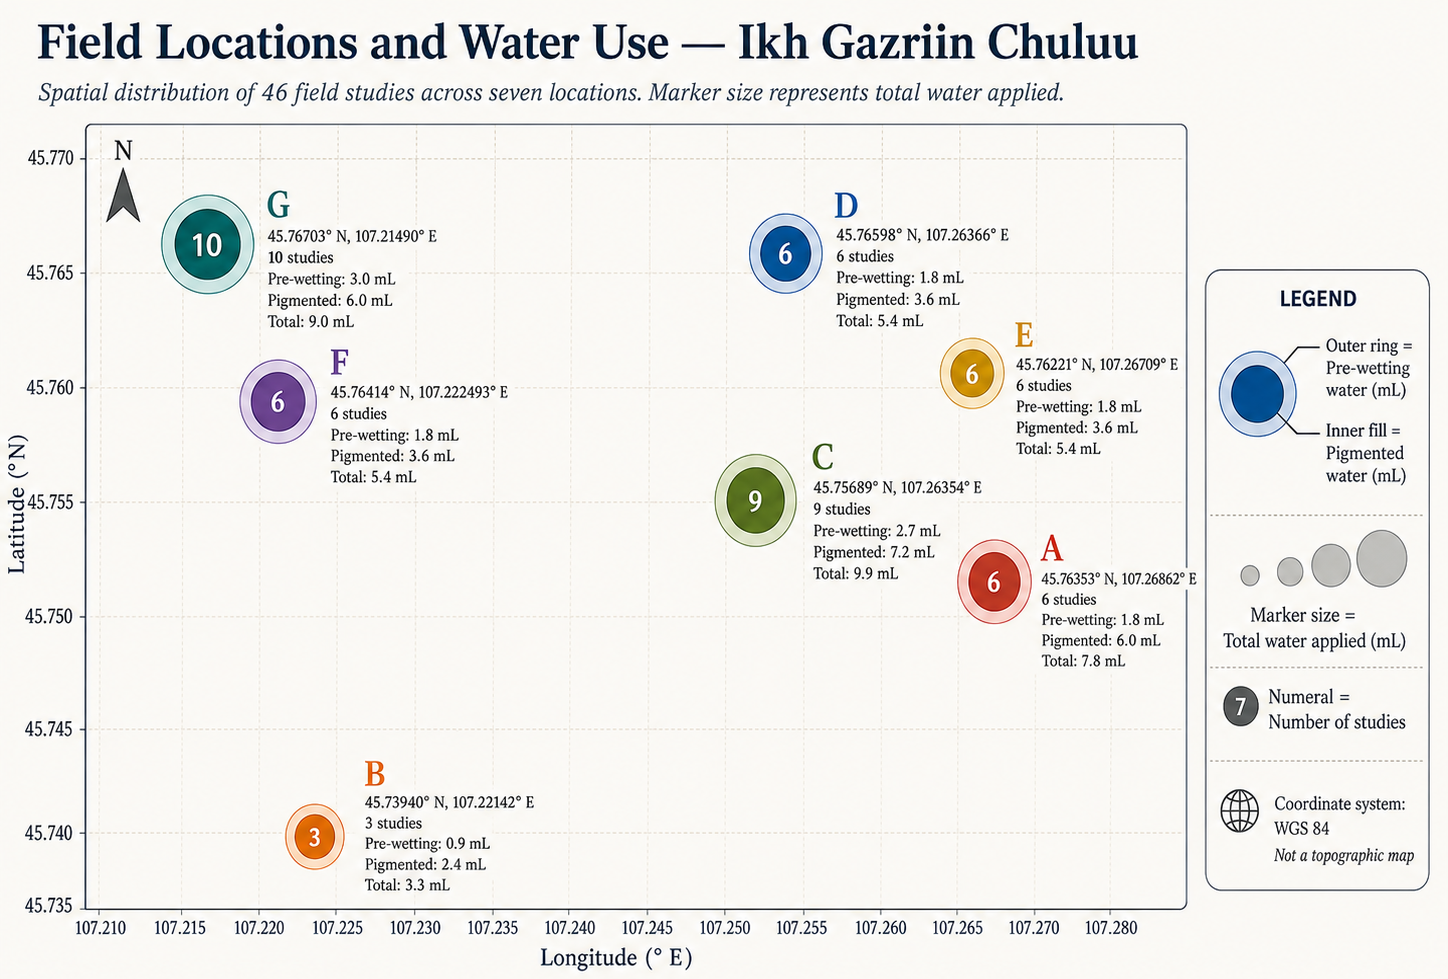
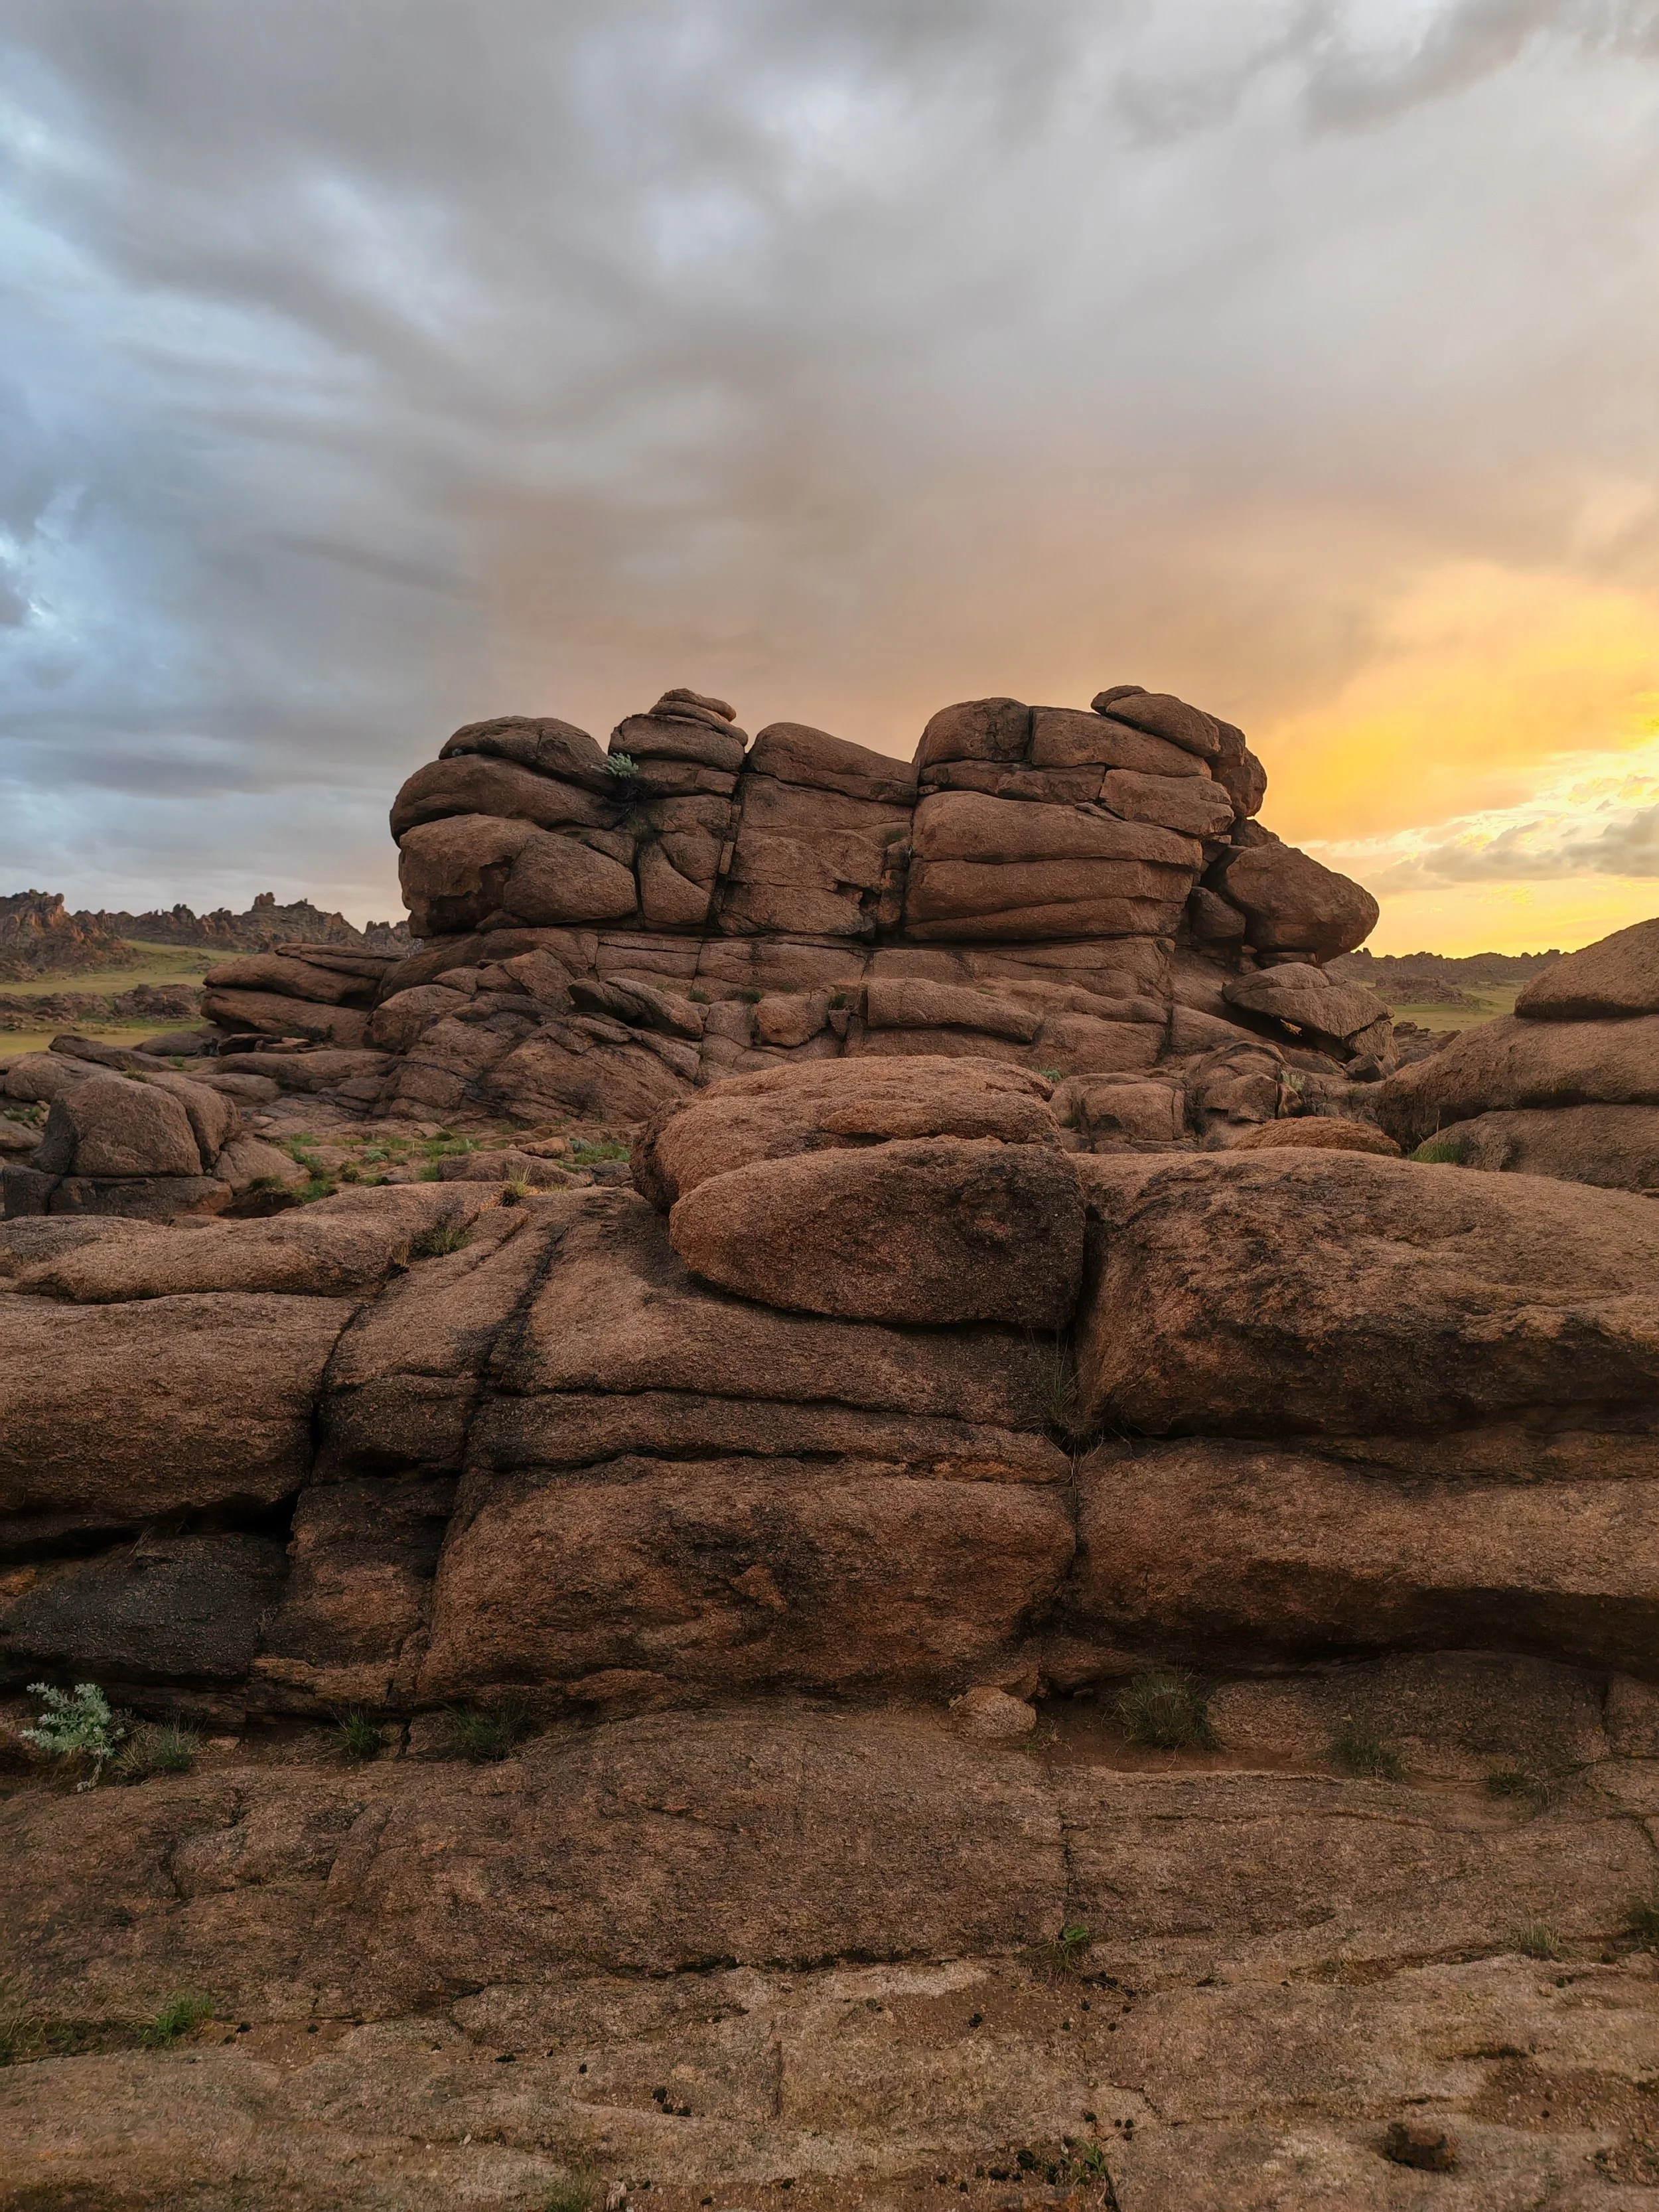
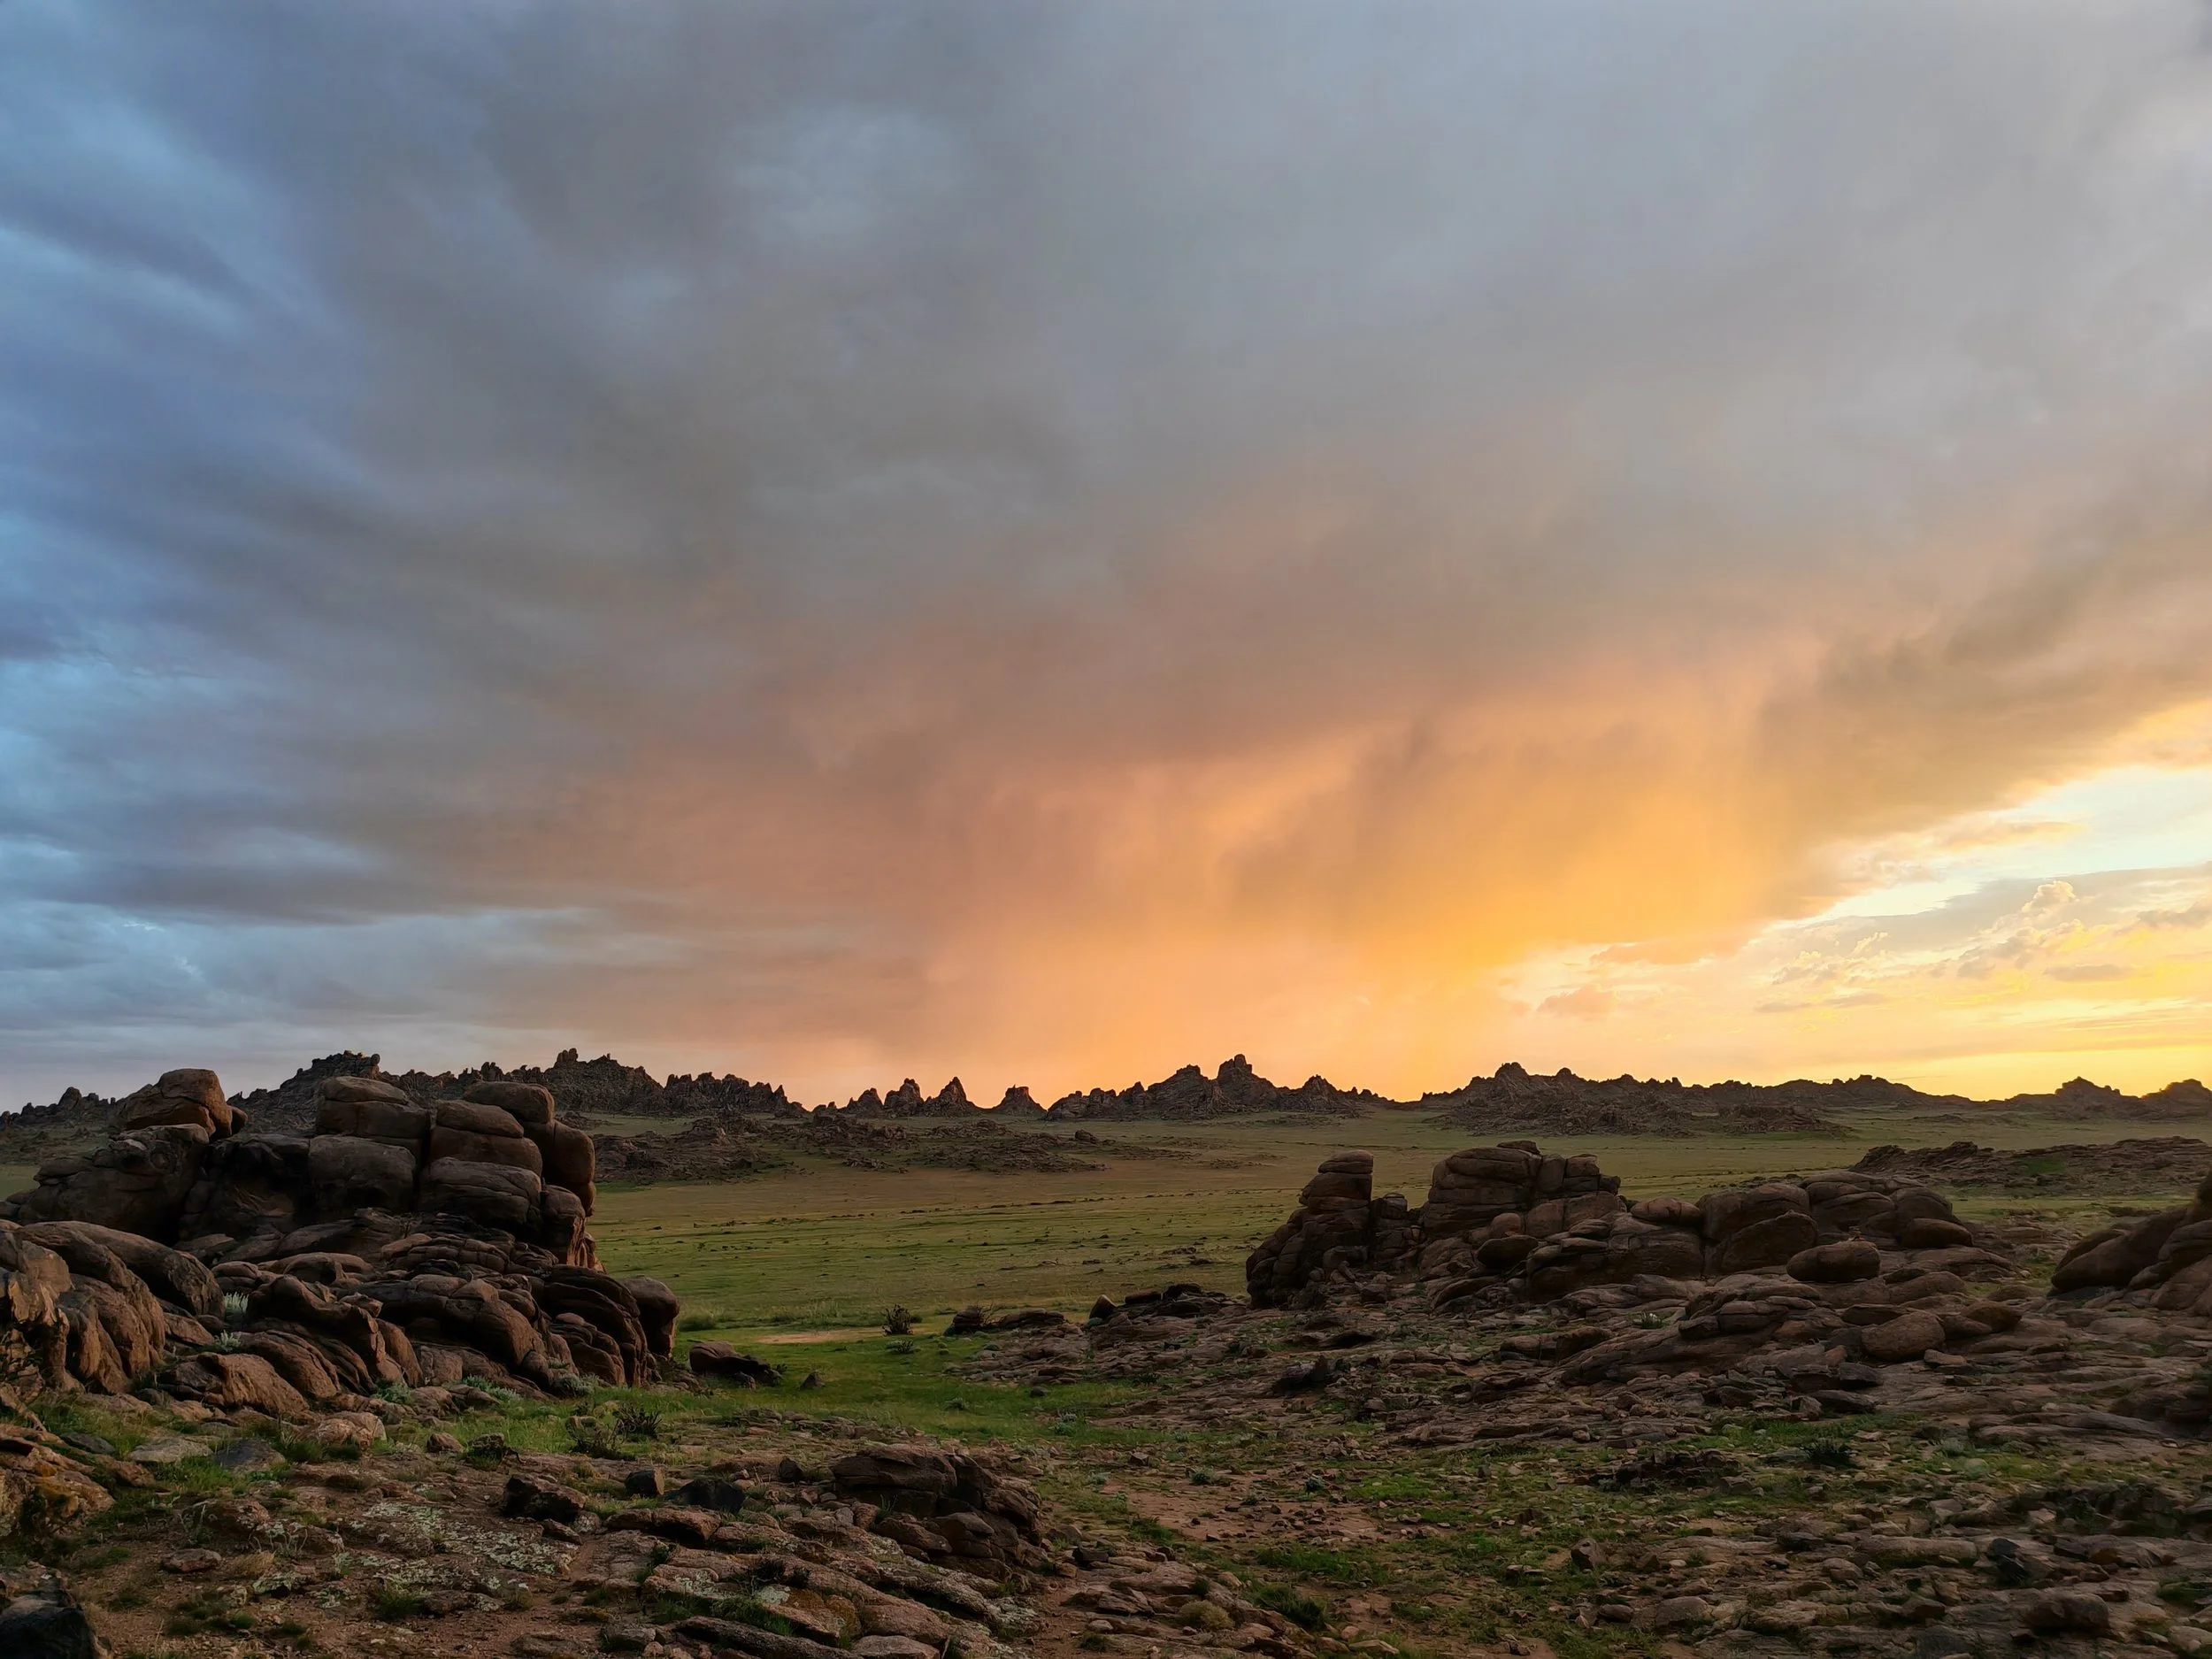
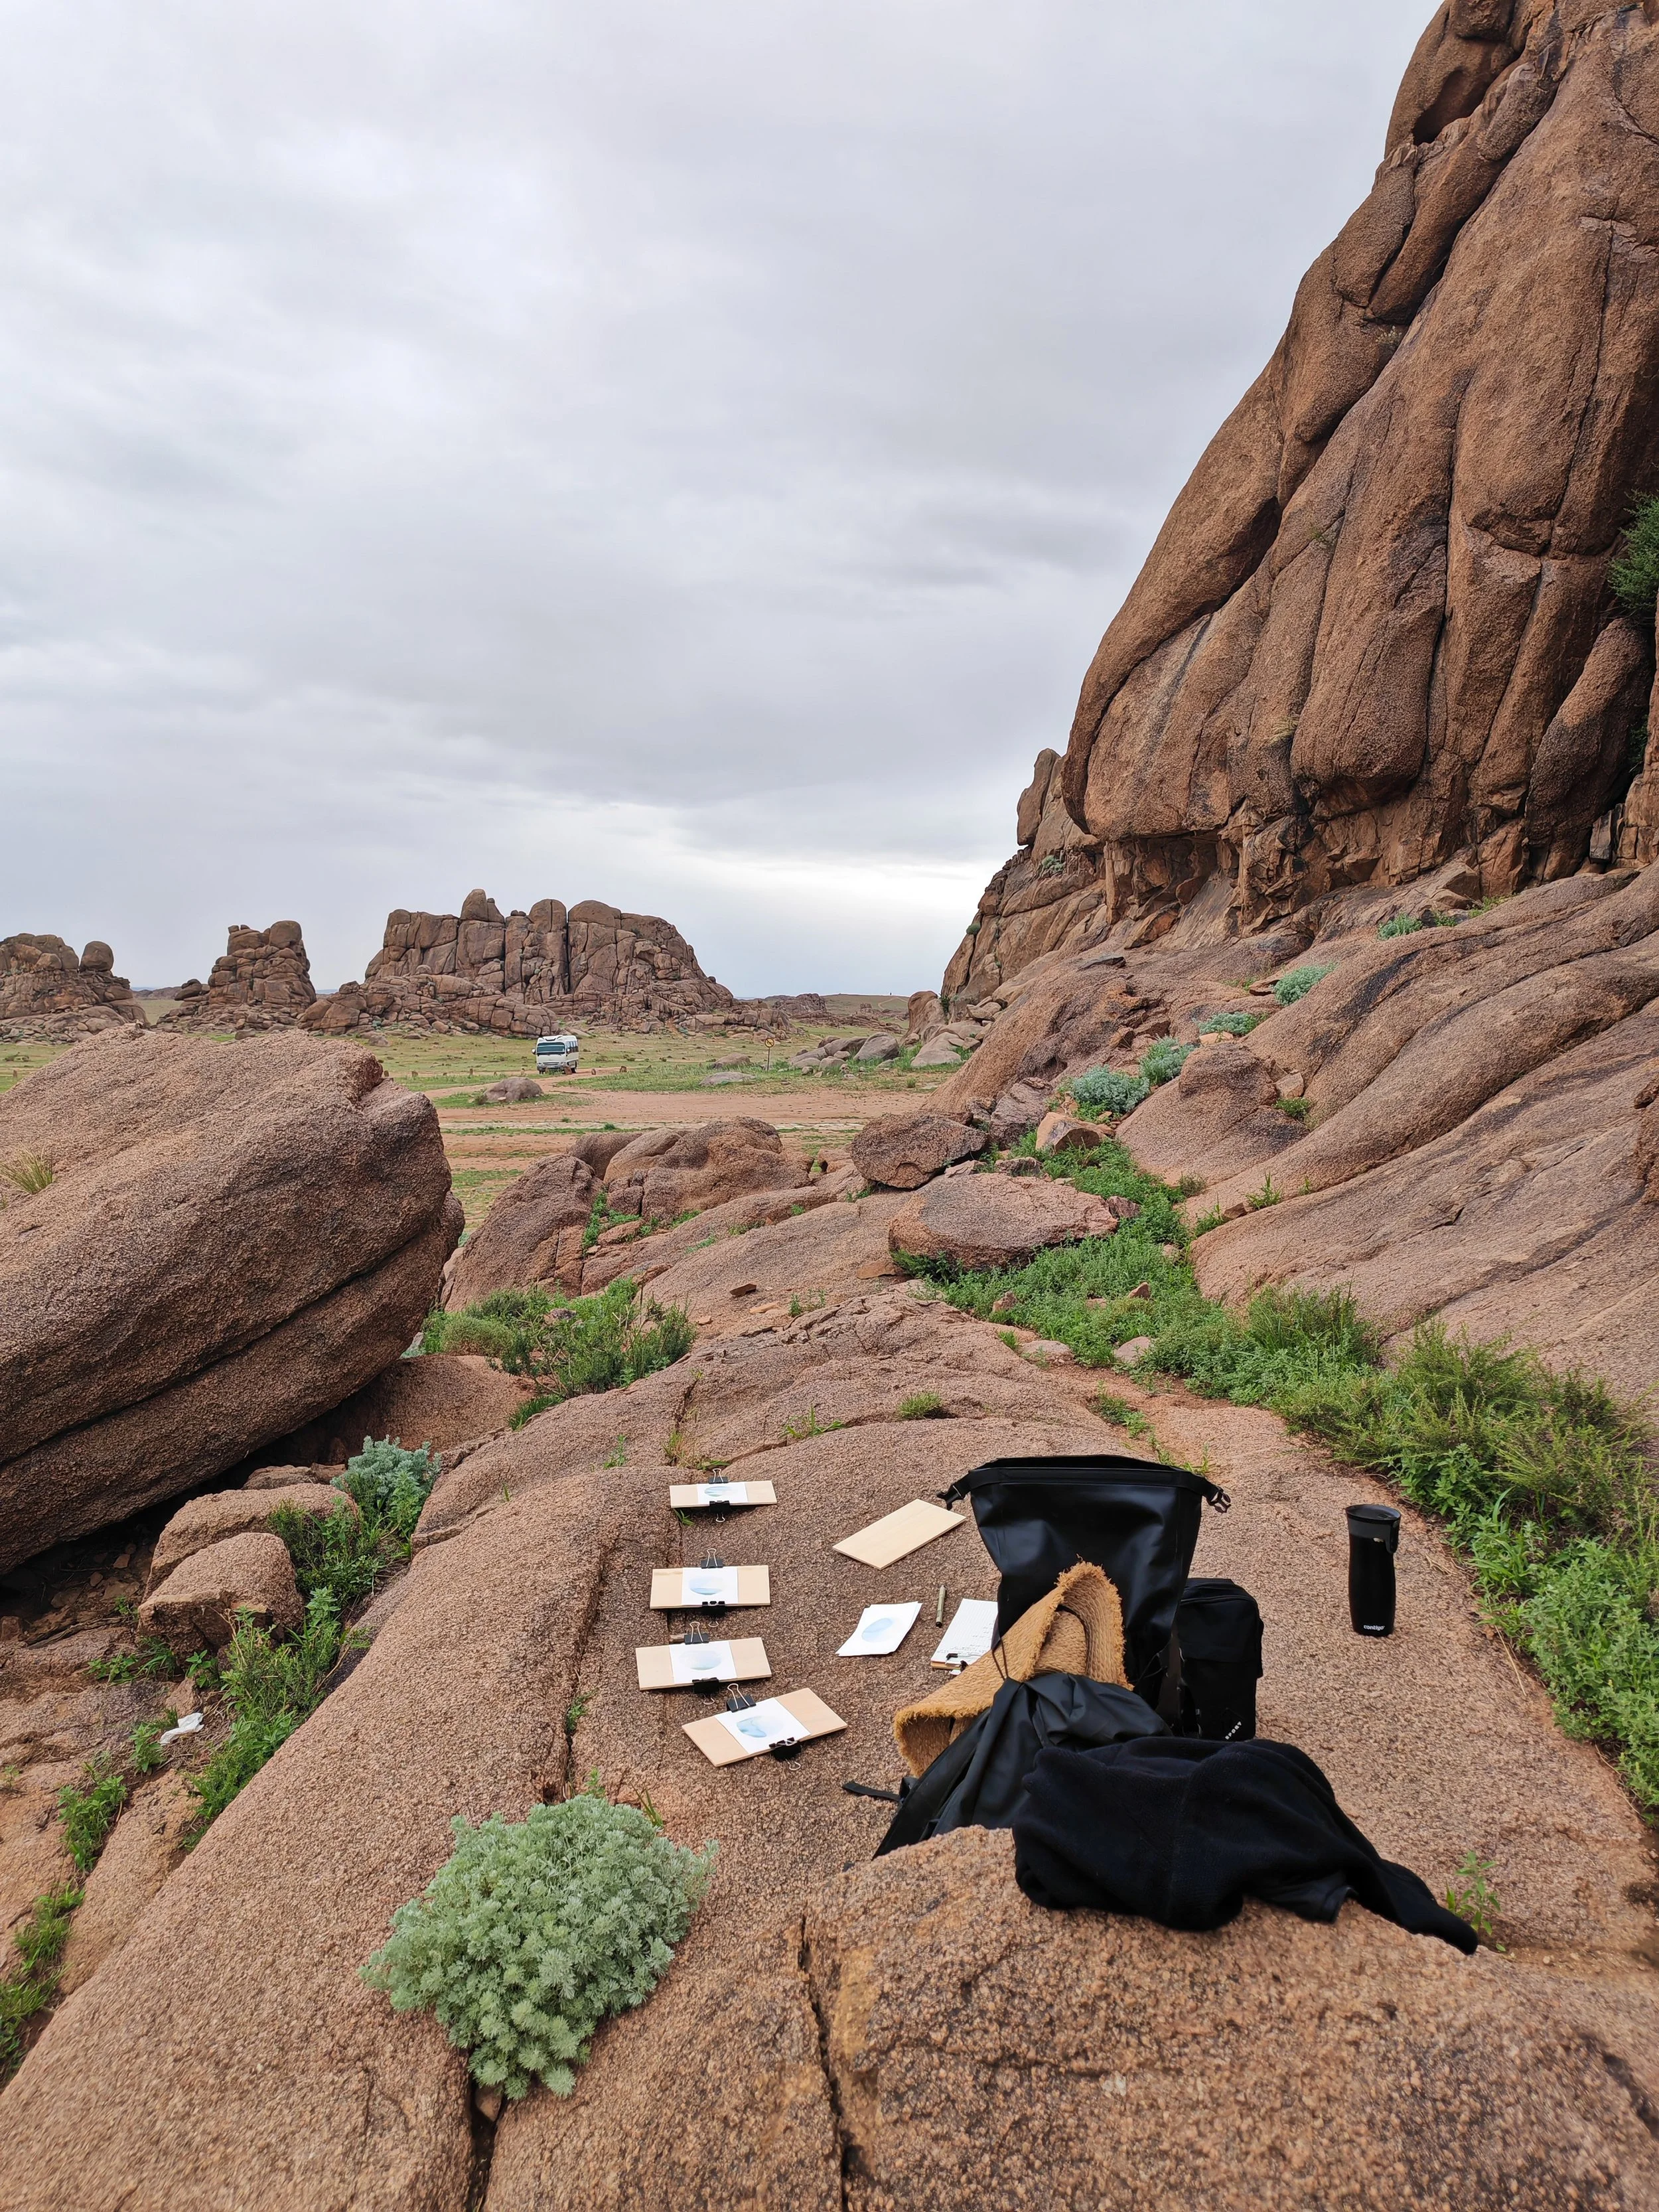
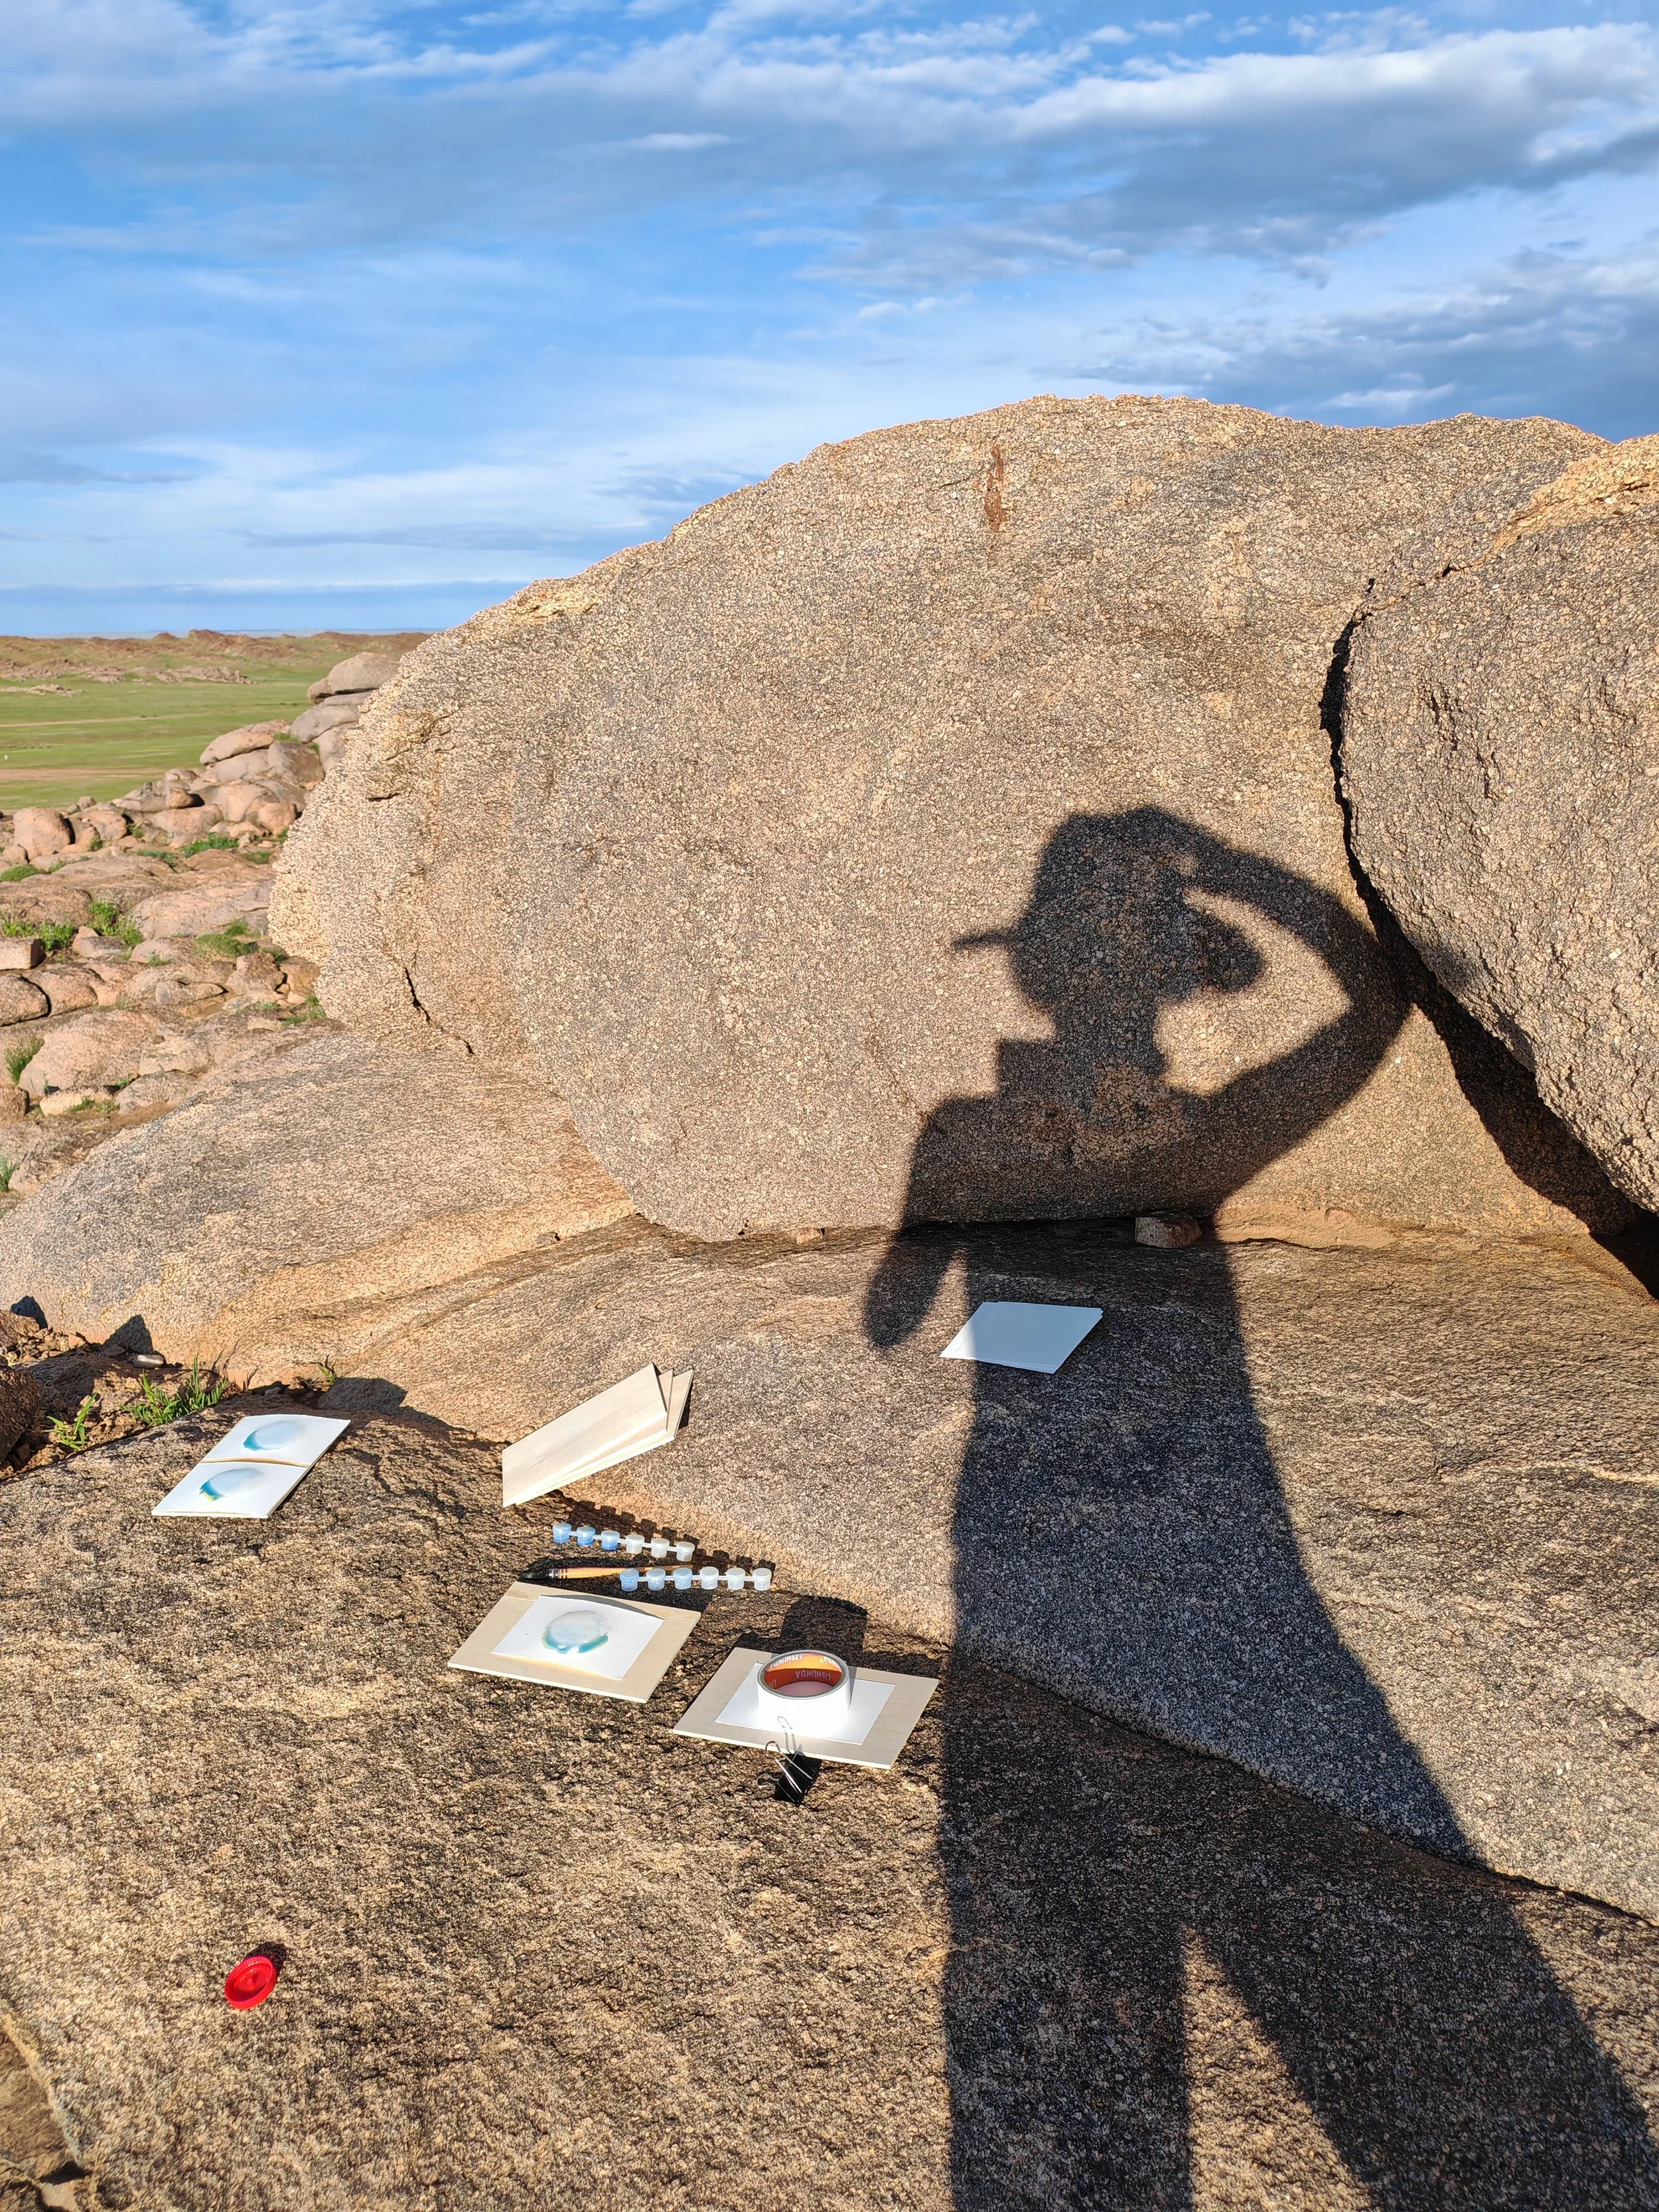
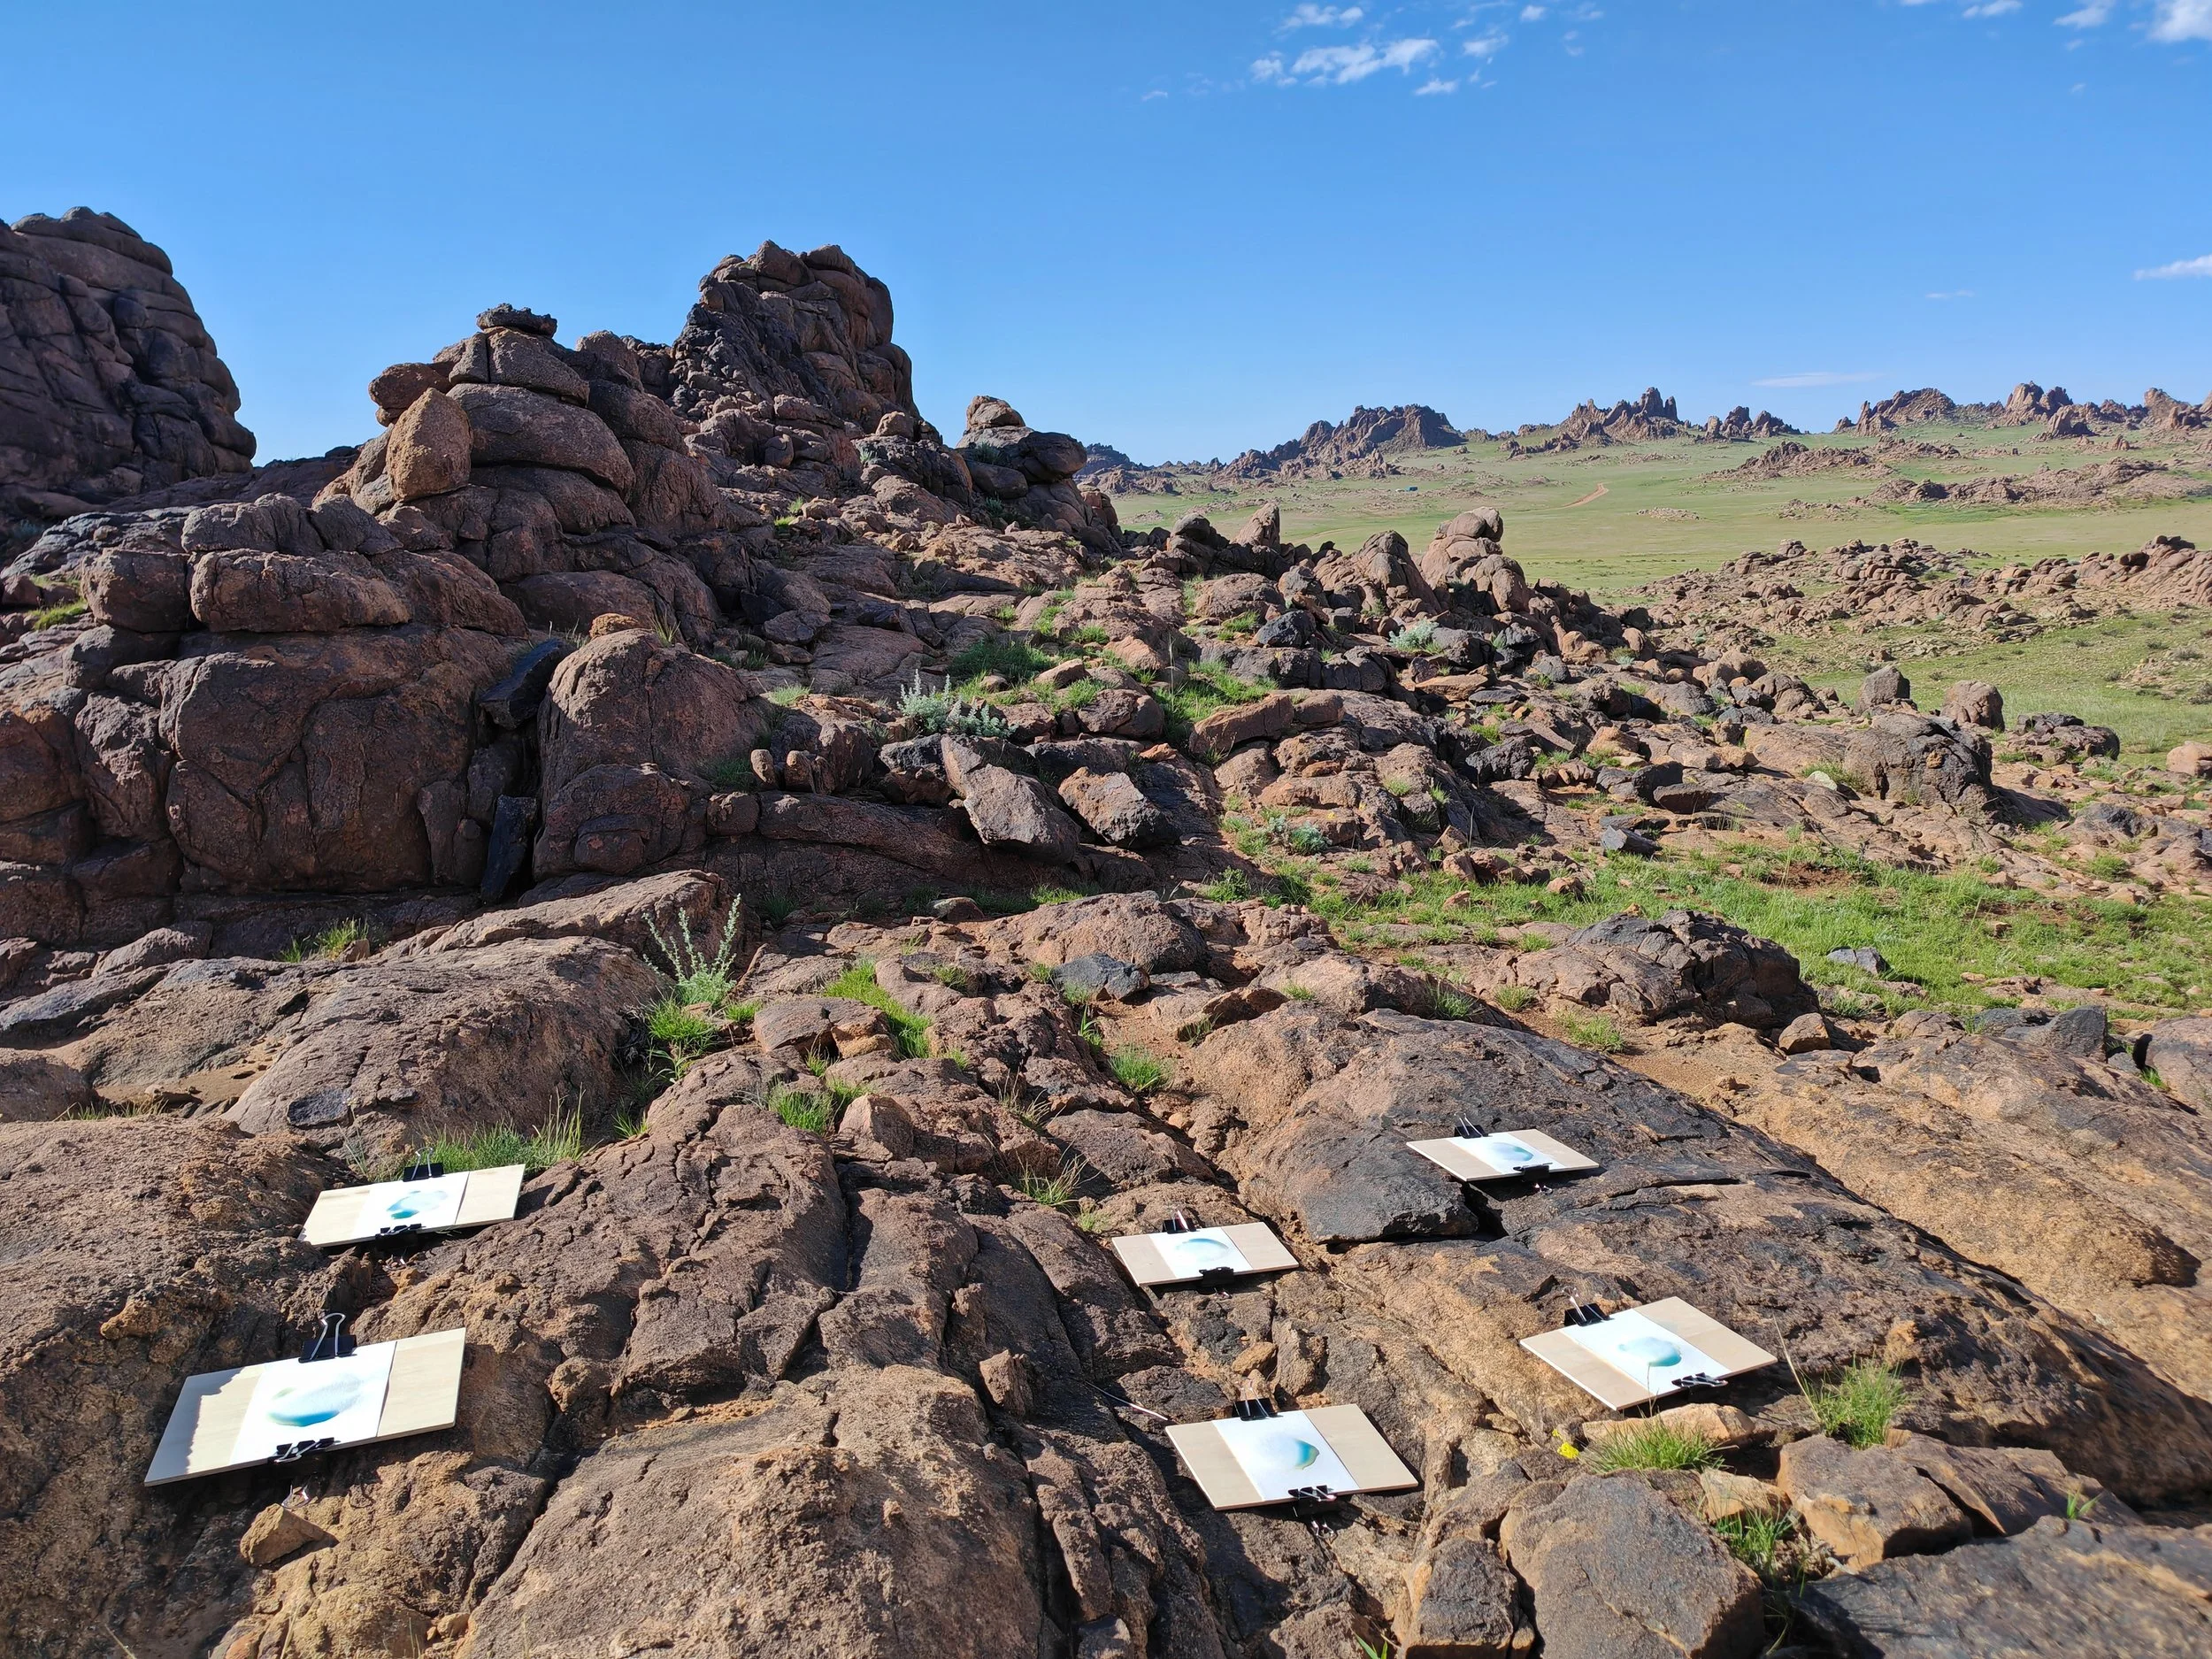
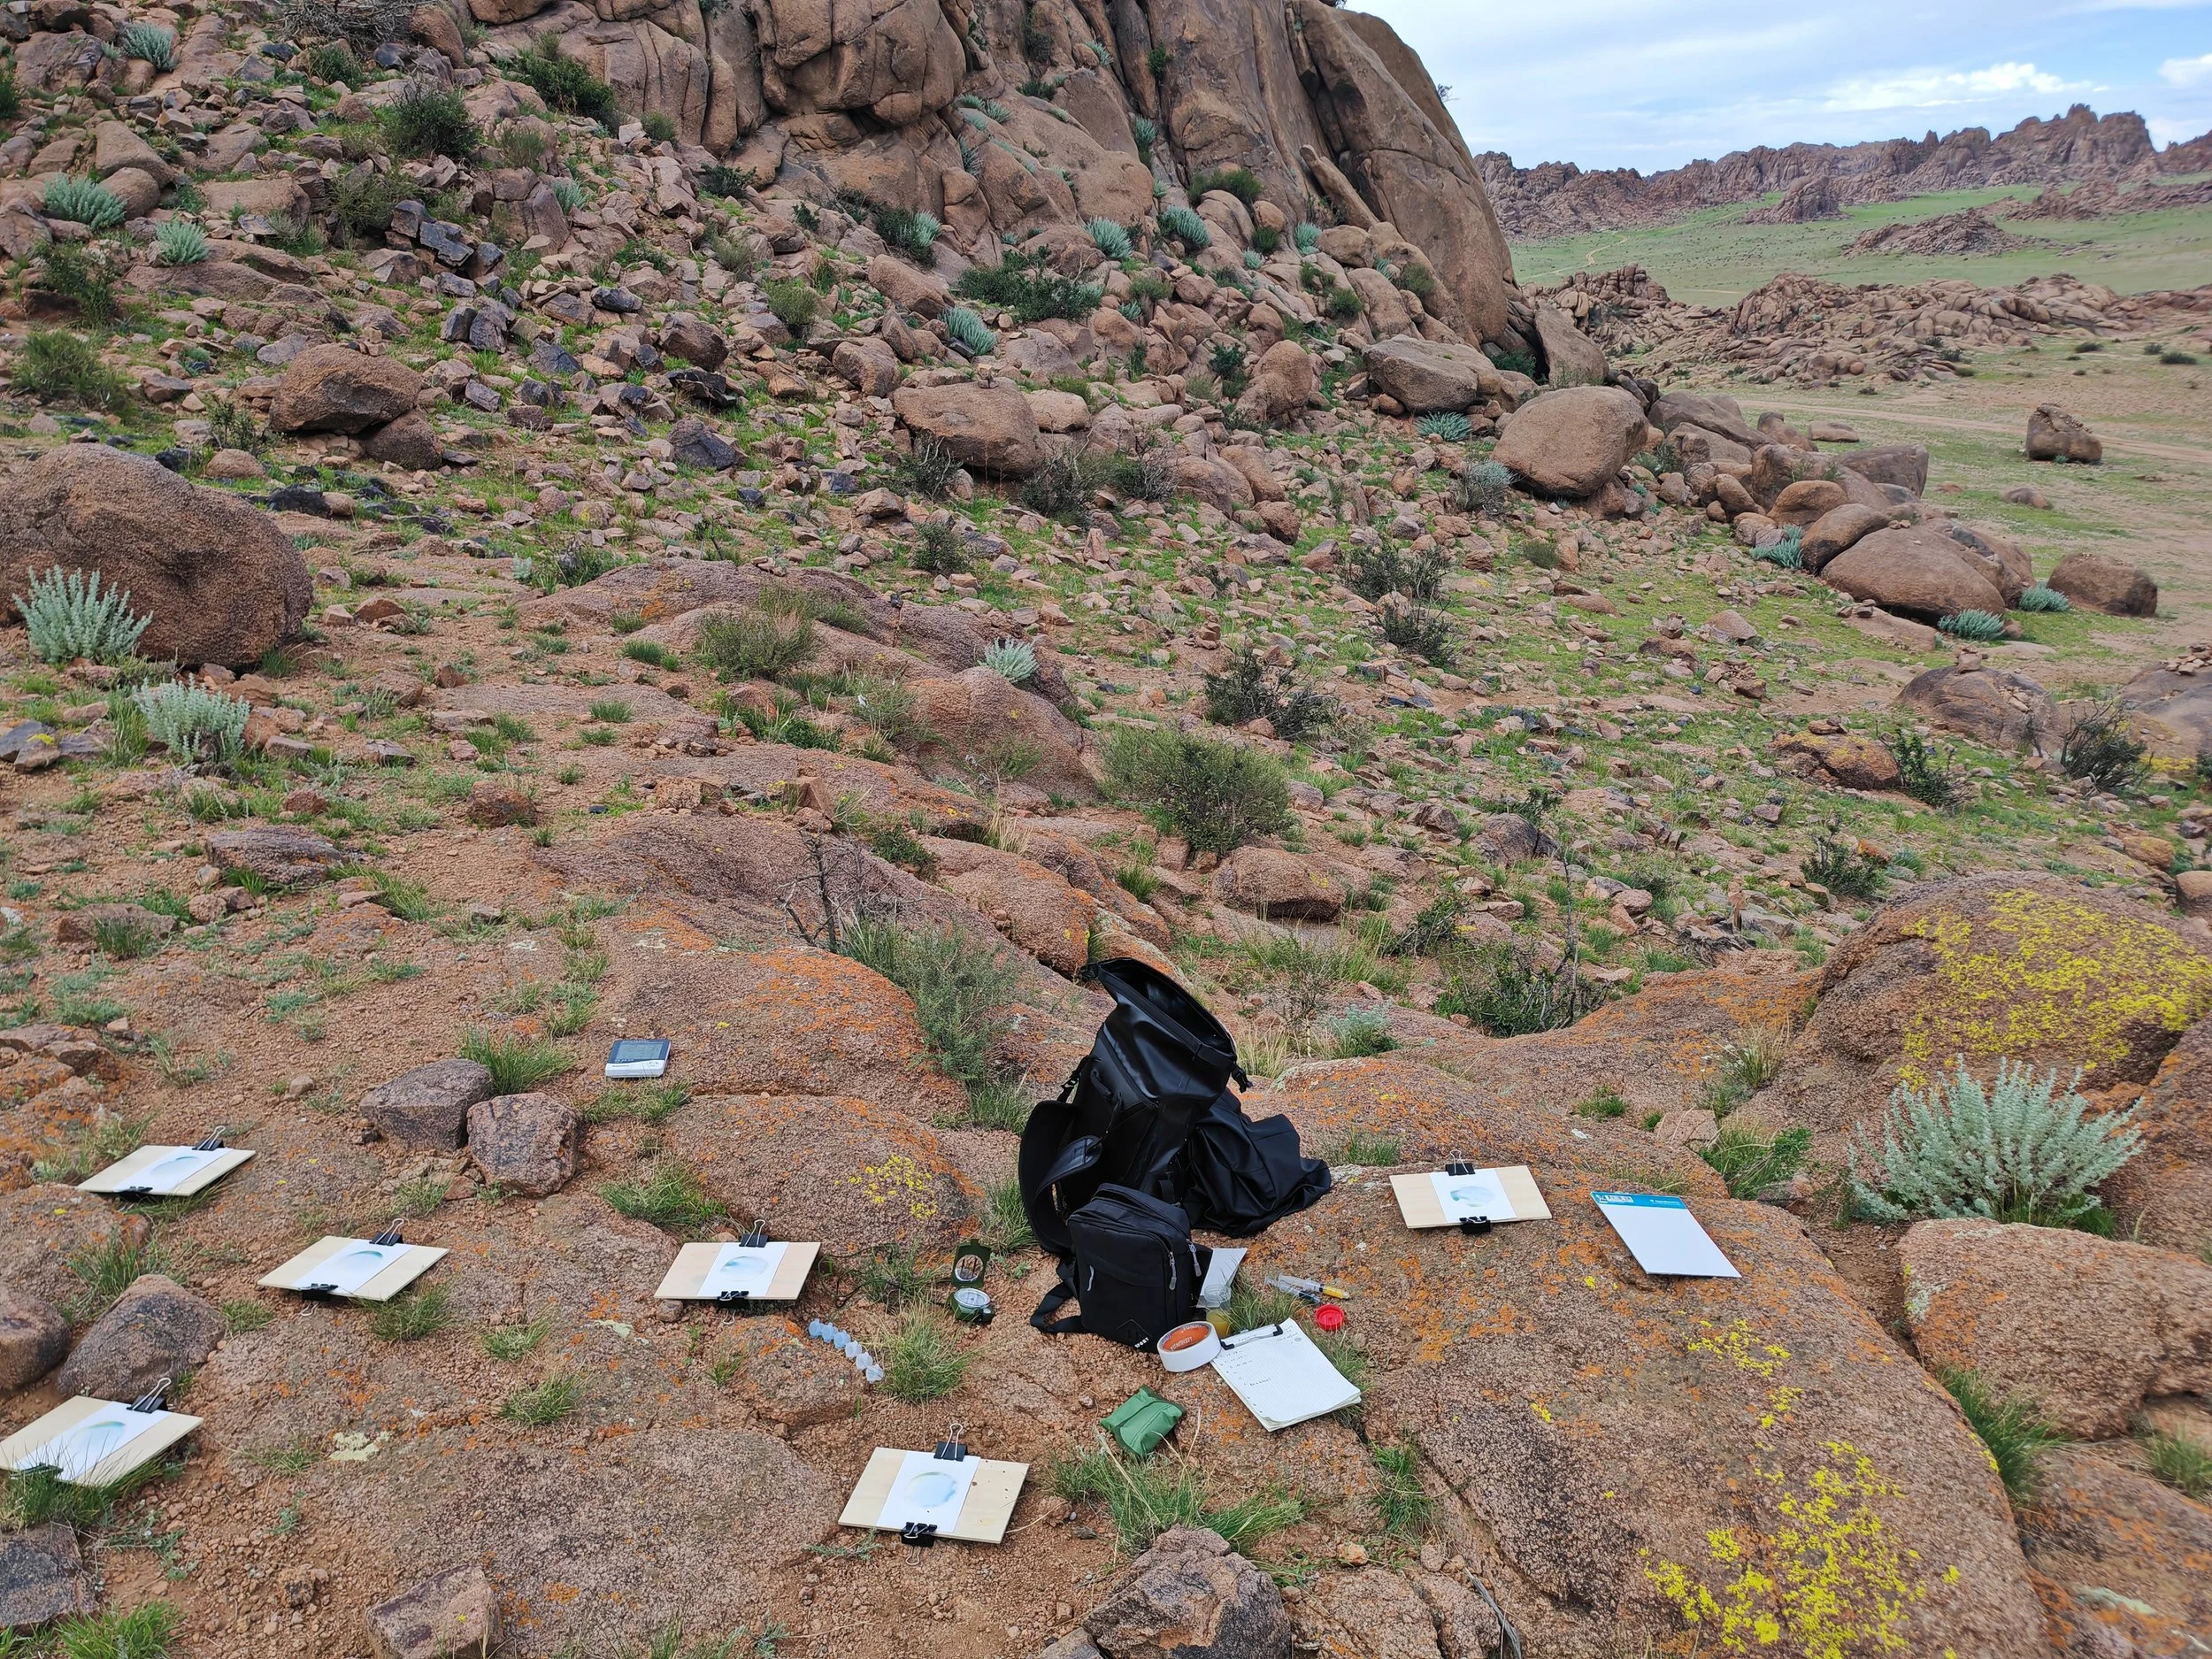
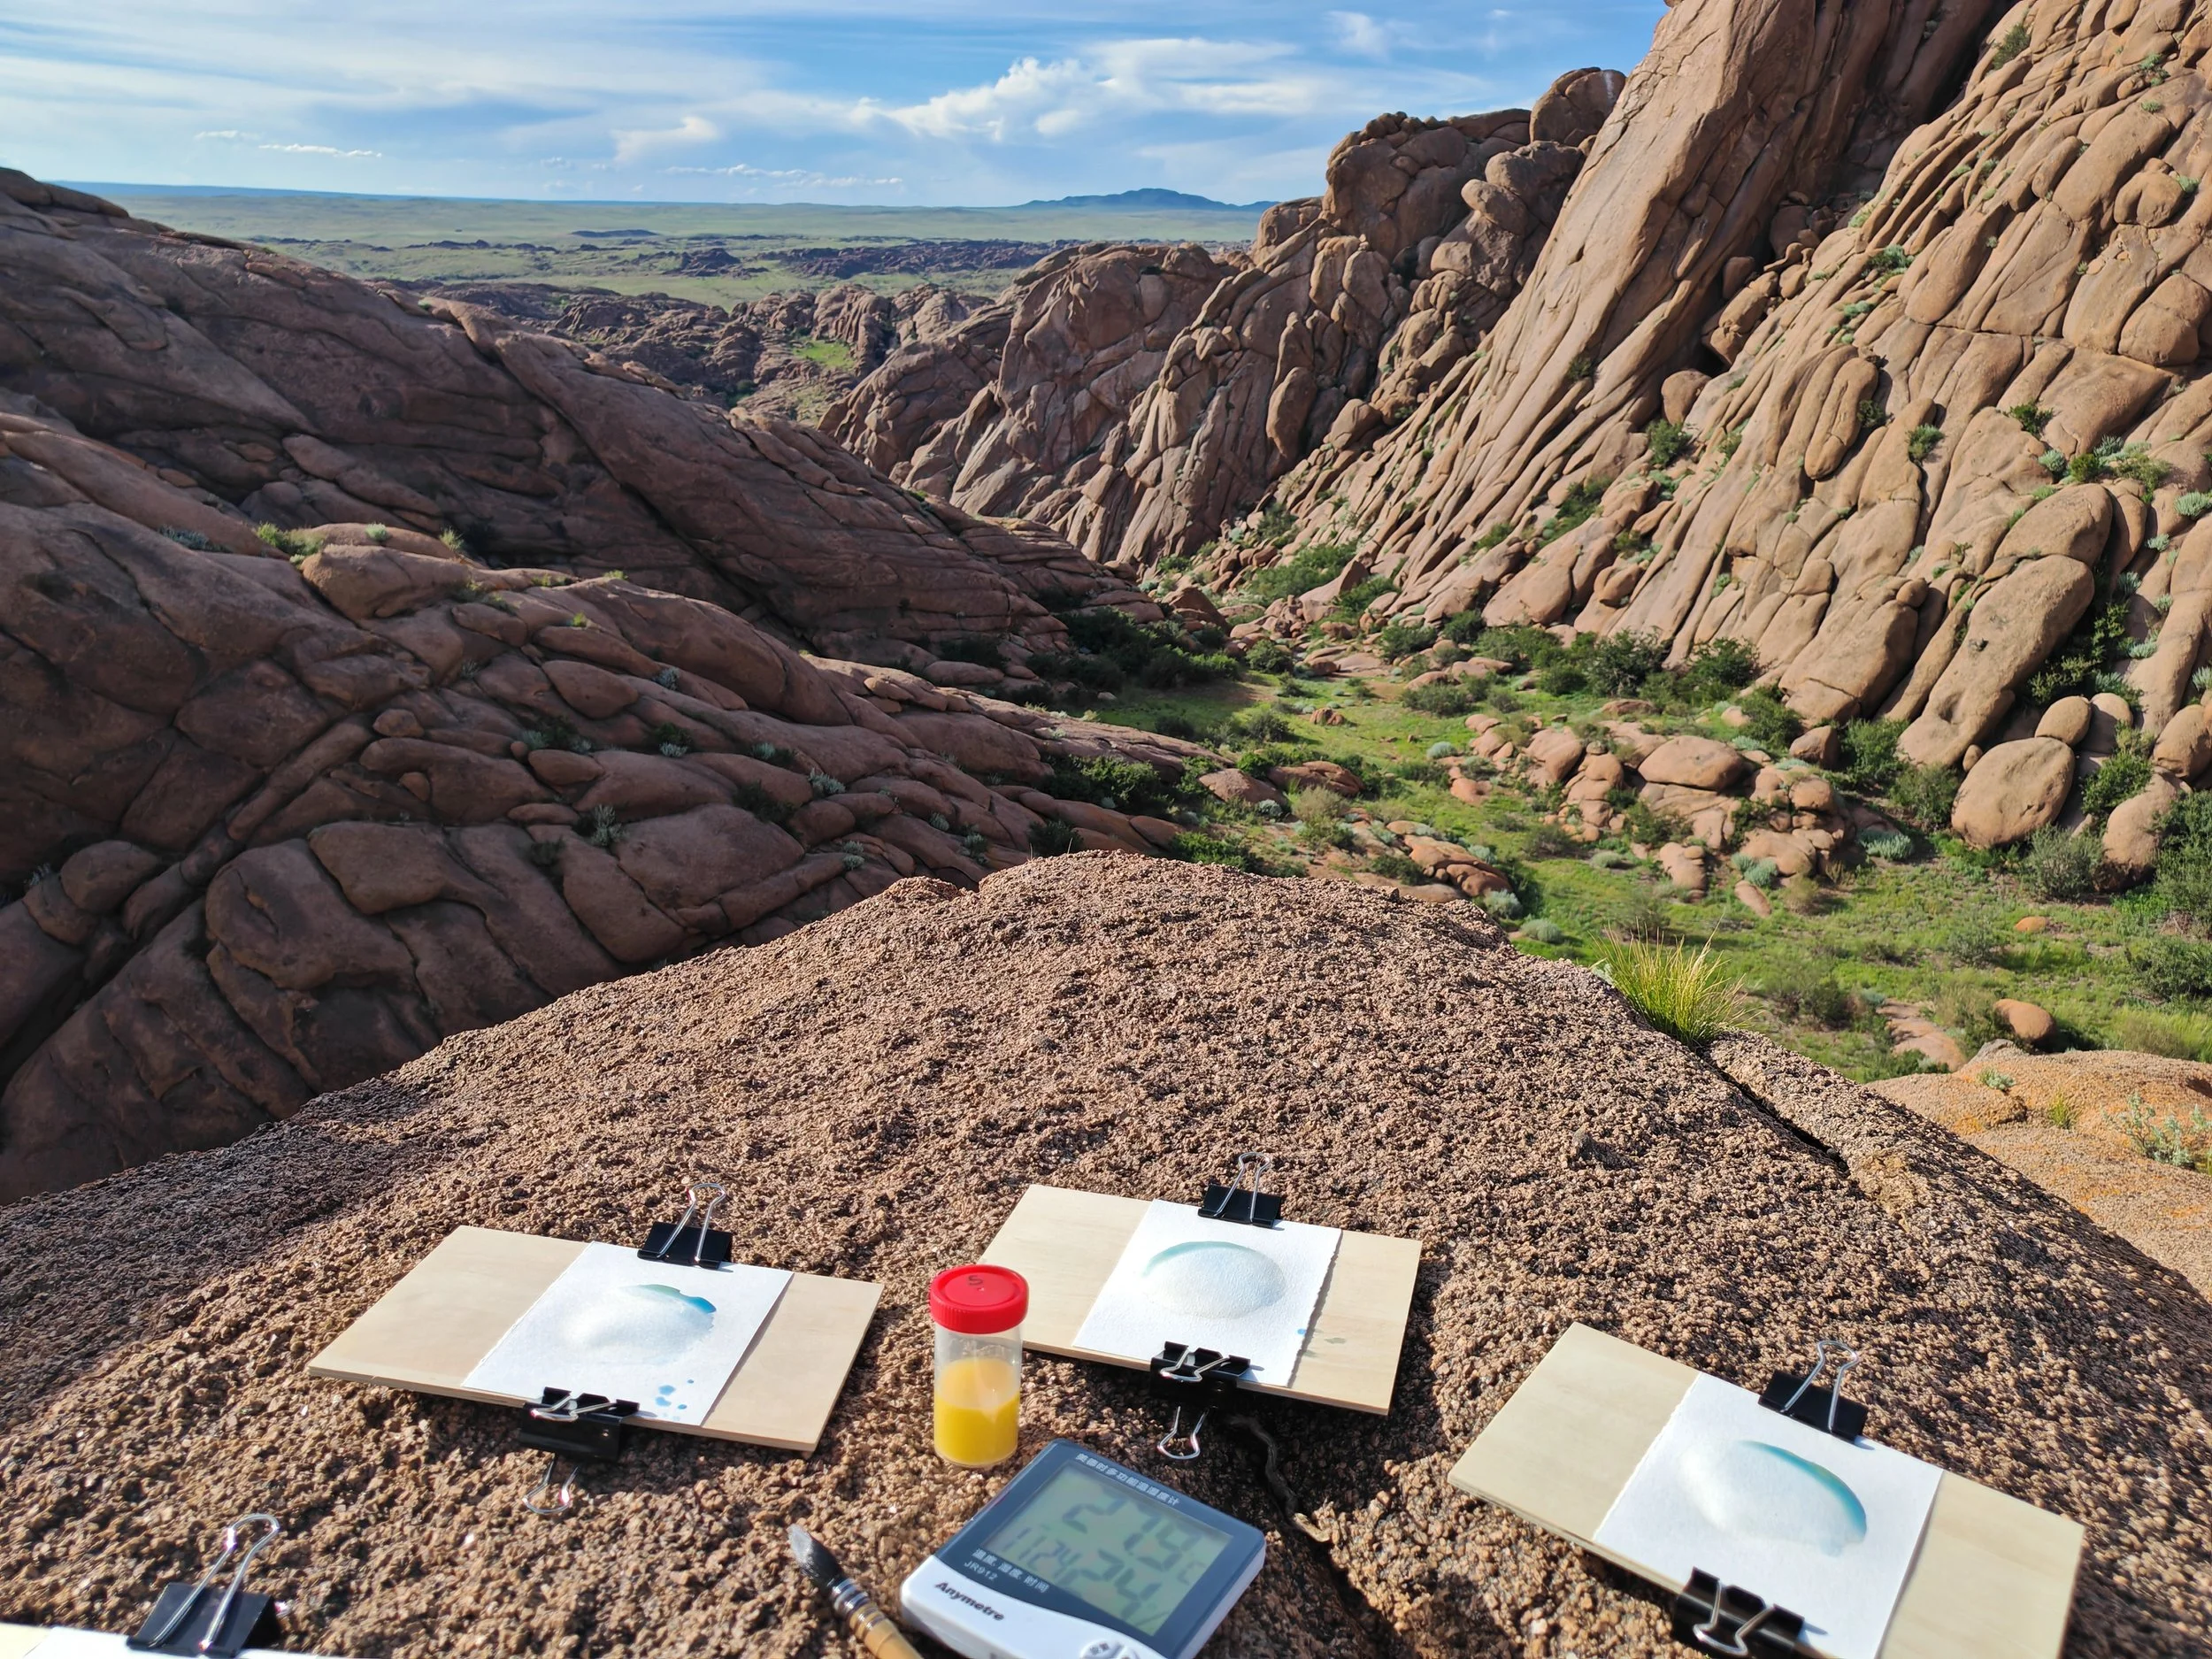
Ikh Gazriin Chuluu provided a particular spatial and climatic context for the investigations. The region should not be understood as a uniformly dry expanse. Open areas exposed to sunlight alternate with rock formations, shaded zones, passages sheltered from the wind and small-scale transitions. The seven study locations, A to G, were distributed across an area spanning several kilometres. The schematic representation of their coordinates shows an eastern group comprising locations A, C, D and E, with locations F and G farther west. Location B lay distinctly south-west of the other study sites. The map represents only their geographical distribution; topographical properties or actual travel routes cannot be inferred from it.
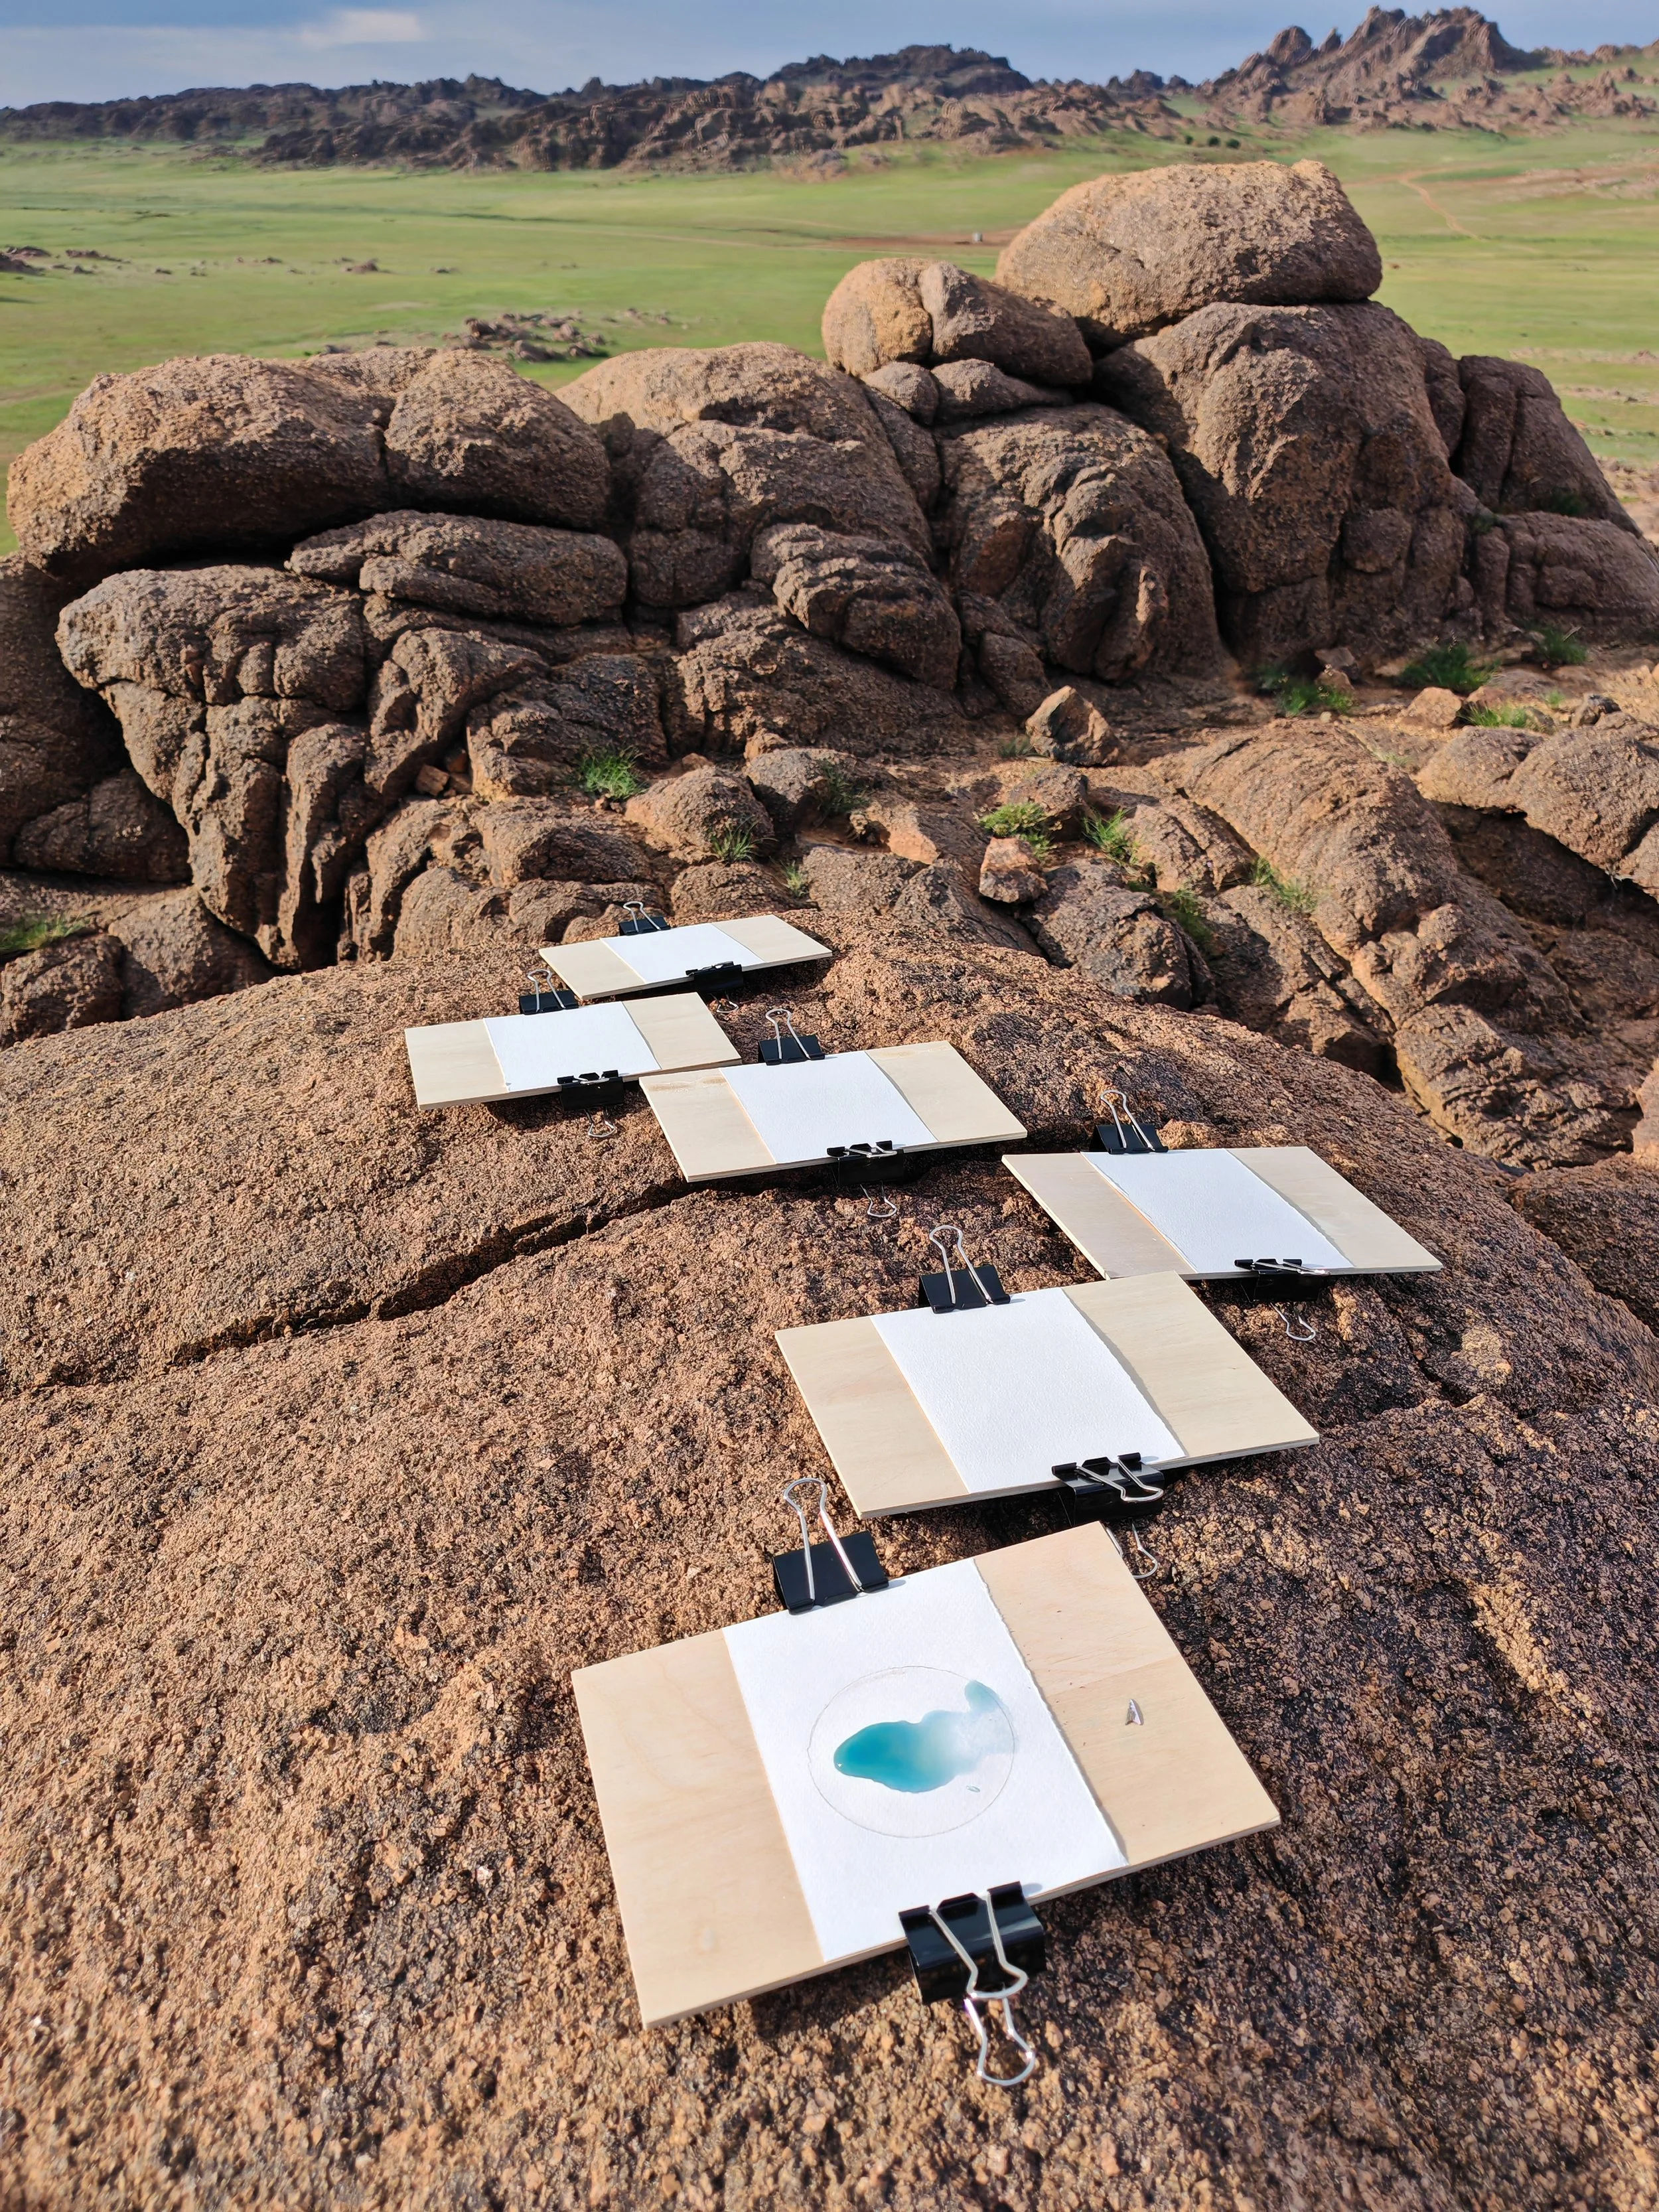
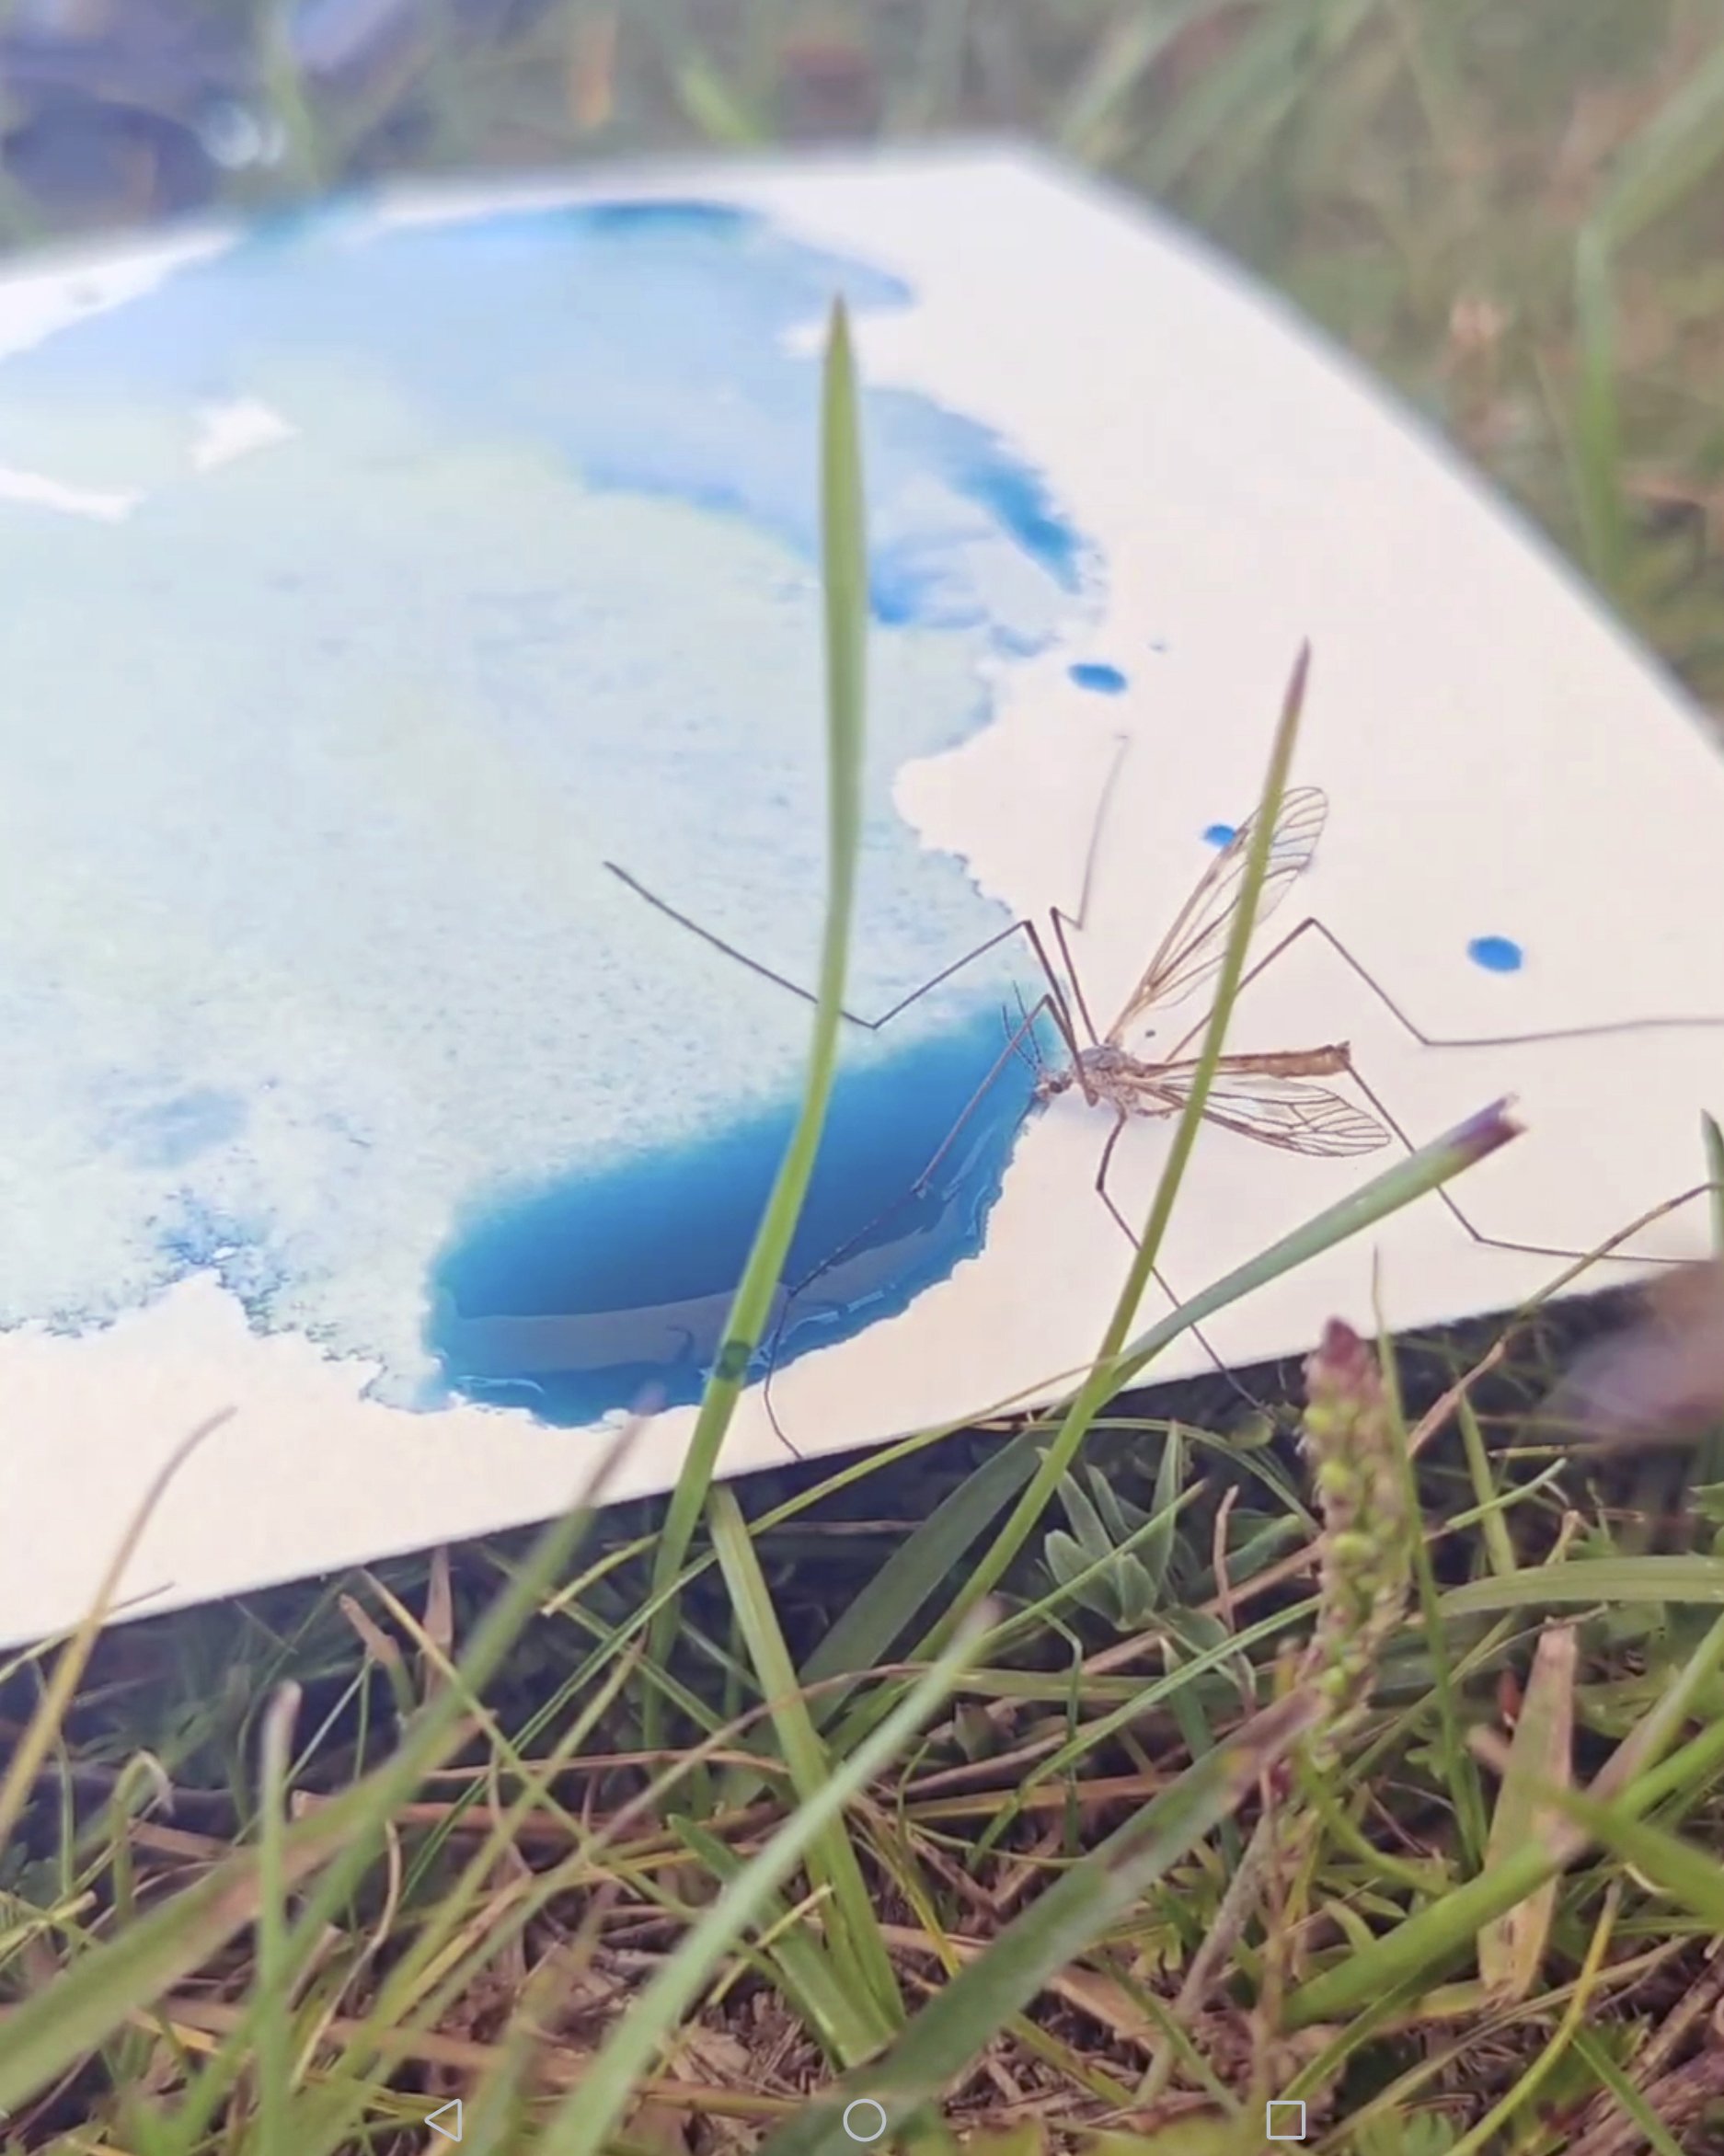
Different temperatures, humidity levels, wind directions, light conditions and precipitation events occurred during the fieldwork. Even sites in close spatial proximity could have different microclimatic conditions. These parameters did not, however, act on the images in isolation. Temperature, wind and humidity did not each produce an unequivocally assignable form. The results should therefore not be read as direct representations of individual measurements. A pigment edge does not correspond exclusively to a particular temperature; a short drying duration cannot be explained by wind or sunlight alone. Instead, the site becomes visually legible through the interaction of different conditions. Its effects appear in the differences between the works: in spread, absorption, pigment transport, edge formation, drying duration and interruption.